Immigrants from Taiwan vs Slavic Currently Married
COMPARE
Immigrants from Taiwan
Slavic
Currently Married
Currently Married Comparison
Immigrants from Taiwan
Slavs
50.7%
CURRENTLY MARRIED
100.0/ 100
METRIC RATING
4th/ 347
METRIC RANK
48.4%
CURRENTLY MARRIED
98.3/ 100
METRIC RATING
63rd/ 347
METRIC RANK
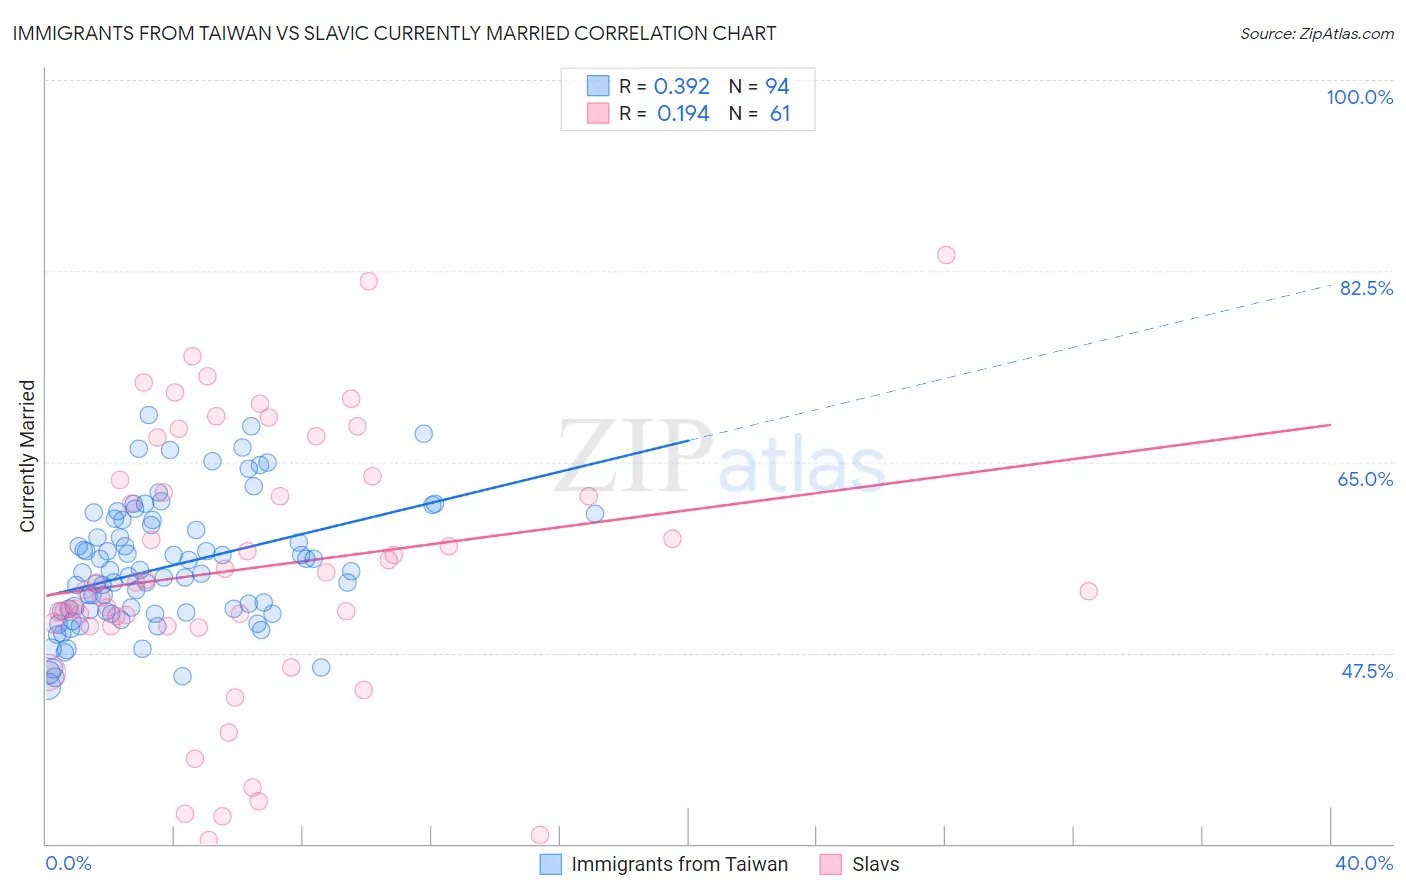
Immigrants from Taiwan vs Slavic Currently Married Correlation Chart
The statistical analysis conducted on geographies consisting of 298,249,316 people shows a mild positive correlation between the proportion of Immigrants from Taiwan and percentage of population currently married in the United States with a correlation coefficient (R) of 0.392 and weighted average of 50.7%. Similarly, the statistical analysis conducted on geographies consisting of 270,868,948 people shows a poor positive correlation between the proportion of Slavs and percentage of population currently married in the United States with a correlation coefficient (R) of 0.194 and weighted average of 48.4%, a difference of 4.9%.
Currently Married Correlation Summary
| Measurement | Immigrants from Taiwan | Slavic |
| Minimum | 44.5% | 30.3% |
| Maximum | 69.2% | 84.0% |
| Range | 24.8% | 53.7% |
| Mean | 55.4% | 55.2% |
| Median | 54.8% | 53.9% |
| Interquartile 25% (IQ1) | 51.2% | 50.0% |
| Interquartile 75% (IQ3) | 59.6% | 63.5% |
| Interquartile Range (IQR) | 8.4% | 13.6% |
| Standard Deviation (Sample) | 5.8% | 12.2% |
| Standard Deviation (Population) | 5.7% | 12.1% |
Similar Demographics by Currently Married
Demographics Similar to Immigrants from Taiwan by Currently Married
In terms of currently married, the demographic groups most similar to Immigrants from Taiwan are Assyrian/Chaldean/Syriac (50.8%, a difference of 0.080%), Thai (50.9%, a difference of 0.26%), Danish (50.5%, a difference of 0.55%), Norwegian (50.2%, a difference of 1.1%), and Immigrants from South Central Asia (50.0%, a difference of 1.4%).
| Demographics | Rating | Rank | Currently Married |
| Immigrants | India | 100.0 /100 | #1 | Exceptional 51.8% |
| Thais | 100.0 /100 | #2 | Exceptional 50.9% |
| Assyrians/Chaldeans/Syriacs | 100.0 /100 | #3 | Exceptional 50.8% |
| Immigrants | Taiwan | 100.0 /100 | #4 | Exceptional 50.7% |
| Danes | 100.0 /100 | #5 | Exceptional 50.5% |
| Norwegians | 100.0 /100 | #6 | Exceptional 50.2% |
| Immigrants | South Central Asia | 100.0 /100 | #7 | Exceptional 50.0% |
| Swedes | 100.0 /100 | #8 | Exceptional 50.0% |
| Czechs | 99.9 /100 | #9 | Exceptional 49.9% |
| Filipinos | 99.9 /100 | #10 | Exceptional 49.7% |
| English | 99.9 /100 | #11 | Exceptional 49.7% |
| Swiss | 99.9 /100 | #12 | Exceptional 49.7% |
| Dutch | 99.9 /100 | #13 | Exceptional 49.6% |
| Germans | 99.9 /100 | #14 | Exceptional 49.6% |
| Pennsylvania Germans | 99.9 /100 | #15 | Exceptional 49.6% |
Demographics Similar to Slavs by Currently Married
In terms of currently married, the demographic groups most similar to Slavs are Immigrants from Czechoslovakia (48.4%, a difference of 0.0%), Ukrainian (48.4%, a difference of 0.010%), Tongan (48.3%, a difference of 0.040%), Slovak (48.3%, a difference of 0.050%), and Immigrants from England (48.3%, a difference of 0.060%).
| Demographics | Rating | Rank | Currently Married |
| Latvians | 98.7 /100 | #56 | Exceptional 48.5% |
| Immigrants | Netherlands | 98.6 /100 | #57 | Exceptional 48.5% |
| French | 98.6 /100 | #58 | Exceptional 48.4% |
| Immigrants | Ireland | 98.5 /100 | #59 | Exceptional 48.4% |
| Immigrants | Romania | 98.5 /100 | #60 | Exceptional 48.4% |
| Romanians | 98.5 /100 | #61 | Exceptional 48.4% |
| Asians | 98.5 /100 | #62 | Exceptional 48.4% |
| Slavs | 98.3 /100 | #63 | Exceptional 48.4% |
| Immigrants | Czechoslovakia | 98.3 /100 | #64 | Exceptional 48.4% |
| Ukrainians | 98.3 /100 | #65 | Exceptional 48.4% |
| Tongans | 98.2 /100 | #66 | Exceptional 48.3% |
| Slovaks | 98.2 /100 | #67 | Exceptional 48.3% |
| Immigrants | England | 98.2 /100 | #68 | Exceptional 48.3% |
| Canadians | 98.1 /100 | #69 | Exceptional 48.3% |
| Immigrants | Asia | 97.9 /100 | #70 | Exceptional 48.3% |