Immigrants from Taiwan vs Luxembourger Currently Married
COMPARE
Immigrants from Taiwan
Luxembourger
Currently Married
Currently Married Comparison
Immigrants from Taiwan
Luxembourgers
50.7%
CURRENTLY MARRIED
100.0/ 100
METRIC RATING
4th/ 347
METRIC RANK
49.3%
CURRENTLY MARRIED
99.8/ 100
METRIC RATING
20th/ 347
METRIC RANK
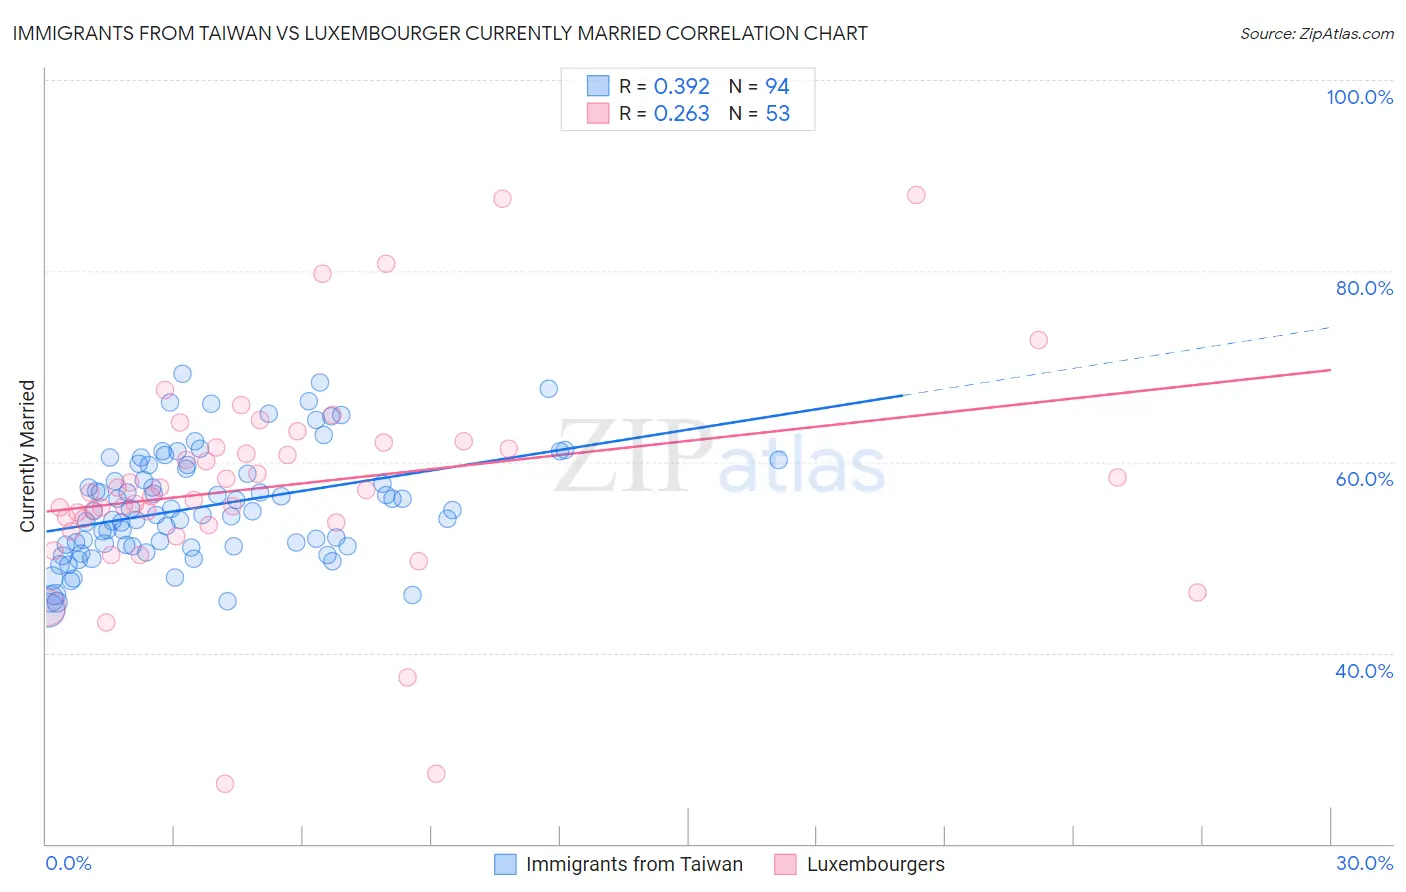
Immigrants from Taiwan vs Luxembourger Currently Married Correlation Chart
The statistical analysis conducted on geographies consisting of 298,249,316 people shows a mild positive correlation between the proportion of Immigrants from Taiwan and percentage of population currently married in the United States with a correlation coefficient (R) of 0.392 and weighted average of 50.7%. Similarly, the statistical analysis conducted on geographies consisting of 144,673,478 people shows a weak positive correlation between the proportion of Luxembourgers and percentage of population currently married in the United States with a correlation coefficient (R) of 0.263 and weighted average of 49.3%, a difference of 3.0%.
Currently Married Correlation Summary
| Measurement | Immigrants from Taiwan | Luxembourger |
| Minimum | 44.5% | 26.3% |
| Maximum | 69.2% | 88.0% |
| Range | 24.8% | 61.7% |
| Mean | 55.4% | 57.5% |
| Median | 54.8% | 56.7% |
| Interquartile 25% (IQ1) | 51.2% | 53.5% |
| Interquartile 75% (IQ3) | 59.6% | 61.7% |
| Interquartile Range (IQR) | 8.4% | 8.2% |
| Standard Deviation (Sample) | 5.8% | 11.4% |
| Standard Deviation (Population) | 5.7% | 11.2% |
Demographics Similar to Immigrants from Taiwan and Luxembourgers by Currently Married
In terms of currently married, the demographic groups most similar to Immigrants from Taiwan are Assyrian/Chaldean/Syriac (50.8%, a difference of 0.080%), Thai (50.9%, a difference of 0.26%), Danish (50.5%, a difference of 0.55%), Norwegian (50.2%, a difference of 1.1%), and Immigrants from South Central Asia (50.0%, a difference of 1.4%). Similarly, the demographic groups most similar to Luxembourgers are Scottish (49.2%, a difference of 0.11%), European (49.3%, a difference of 0.14%), Immigrants from Scotland (49.3%, a difference of 0.15%), Bulgarian (49.1%, a difference of 0.33%), and Scandinavian (49.5%, a difference of 0.44%).
| Demographics | Rating | Rank | Currently Married |
| Thais | 100.0 /100 | #2 | Exceptional 50.9% |
| Assyrians/Chaldeans/Syriacs | 100.0 /100 | #3 | Exceptional 50.8% |
| Immigrants | Taiwan | 100.0 /100 | #4 | Exceptional 50.7% |
| Danes | 100.0 /100 | #5 | Exceptional 50.5% |
| Norwegians | 100.0 /100 | #6 | Exceptional 50.2% |
| Immigrants | South Central Asia | 100.0 /100 | #7 | Exceptional 50.0% |
| Swedes | 100.0 /100 | #8 | Exceptional 50.0% |
| Czechs | 99.9 /100 | #9 | Exceptional 49.9% |
| Filipinos | 99.9 /100 | #10 | Exceptional 49.7% |
| English | 99.9 /100 | #11 | Exceptional 49.7% |
| Swiss | 99.9 /100 | #12 | Exceptional 49.7% |
| Dutch | 99.9 /100 | #13 | Exceptional 49.6% |
| Germans | 99.9 /100 | #14 | Exceptional 49.6% |
| Pennsylvania Germans | 99.9 /100 | #15 | Exceptional 49.6% |
| Chinese | 99.9 /100 | #16 | Exceptional 49.5% |
| Scandinavians | 99.9 /100 | #17 | Exceptional 49.5% |
| Immigrants | Scotland | 99.8 /100 | #18 | Exceptional 49.3% |
| Europeans | 99.8 /100 | #19 | Exceptional 49.3% |
| Luxembourgers | 99.8 /100 | #20 | Exceptional 49.3% |
| Scottish | 99.8 /100 | #21 | Exceptional 49.2% |
| Bulgarians | 99.7 /100 | #22 | Exceptional 49.1% |