Immigrants from Taiwan vs Australian Hearing Disability
COMPARE
Immigrants from Taiwan
Australian
Hearing Disability
Hearing Disability Comparison
Immigrants from Taiwan
Australians
2.6%
HEARING DISABILITY
99.4/ 100
METRIC RATING
41st/ 347
METRIC RANK
3.2%
HEARING DISABILITY
8.1/ 100
METRIC RATING
214th/ 347
METRIC RANK
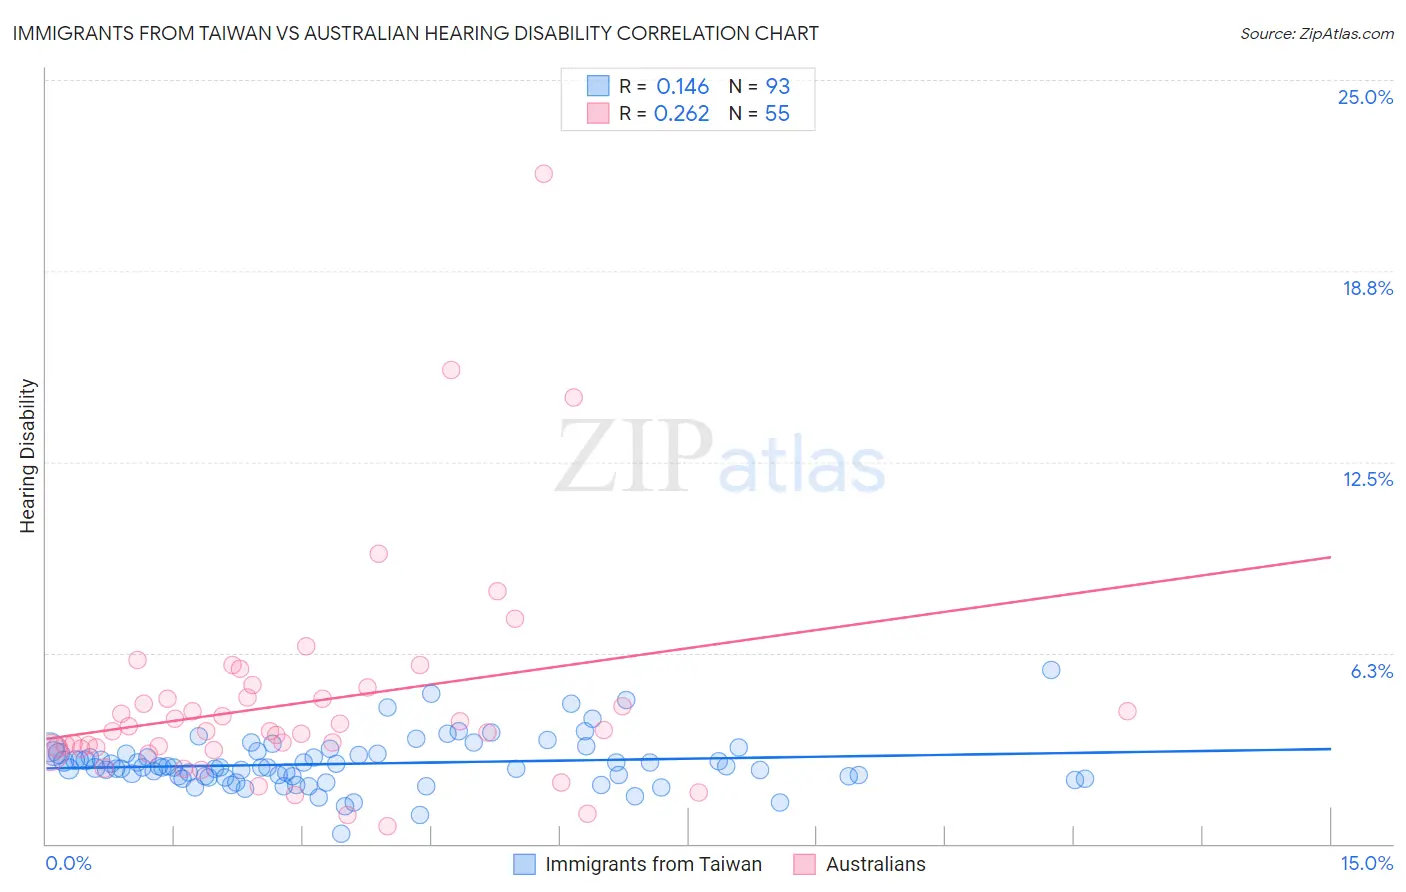
Immigrants from Taiwan vs Australian Hearing Disability Correlation Chart
The statistical analysis conducted on geographies consisting of 298,207,747 people shows a poor positive correlation between the proportion of Immigrants from Taiwan and percentage of population with hearing disability in the United States with a correlation coefficient (R) of 0.146 and weighted average of 2.6%. Similarly, the statistical analysis conducted on geographies consisting of 224,103,986 people shows a weak positive correlation between the proportion of Australians and percentage of population with hearing disability in the United States with a correlation coefficient (R) of 0.262 and weighted average of 3.2%, a difference of 20.1%.
Hearing Disability Correlation Summary
| Measurement | Immigrants from Taiwan | Australian |
| Minimum | 0.31% | 0.57% |
| Maximum | 5.7% | 21.9% |
| Range | 5.4% | 21.4% |
| Mean | 2.6% | 4.6% |
| Median | 2.5% | 3.7% |
| Interquartile 25% (IQ1) | 2.2% | 3.1% |
| Interquartile 75% (IQ3) | 3.0% | 4.8% |
| Interquartile Range (IQR) | 0.78% | 1.7% |
| Standard Deviation (Sample) | 0.82% | 3.6% |
| Standard Deviation (Population) | 0.82% | 3.6% |
Similar Demographics by Hearing Disability
Demographics Similar to Immigrants from Taiwan by Hearing Disability
In terms of hearing disability, the demographic groups most similar to Immigrants from Taiwan are West Indian (2.6%, a difference of 0.010%), Senegalese (2.6%, a difference of 0.010%), Nigerian (2.6%, a difference of 0.23%), Venezuelan (2.6%, a difference of 0.26%), and Haitian (2.6%, a difference of 0.34%).
| Demographics | Rating | Rank | Hearing Disability |
| Immigrants | Pakistan | 99.6 /100 | #34 | Exceptional 2.6% |
| Salvadorans | 99.6 /100 | #35 | Exceptional 2.6% |
| Okinawans | 99.6 /100 | #36 | Exceptional 2.6% |
| Immigrants | Western Africa | 99.6 /100 | #37 | Exceptional 2.6% |
| Immigrants | Jamaica | 99.5 /100 | #38 | Exceptional 2.6% |
| Immigrants | China | 99.5 /100 | #39 | Exceptional 2.6% |
| Haitians | 99.5 /100 | #40 | Exceptional 2.6% |
| Immigrants | Taiwan | 99.4 /100 | #41 | Exceptional 2.6% |
| West Indians | 99.4 /100 | #42 | Exceptional 2.6% |
| Senegalese | 99.4 /100 | #43 | Exceptional 2.6% |
| Nigerians | 99.4 /100 | #44 | Exceptional 2.6% |
| Venezuelans | 99.4 /100 | #45 | Exceptional 2.6% |
| Immigrants | Dominica | 99.3 /100 | #46 | Exceptional 2.6% |
| Immigrants | Israel | 99.3 /100 | #47 | Exceptional 2.6% |
| Immigrants | Singapore | 99.3 /100 | #48 | Exceptional 2.6% |
Demographics Similar to Australians by Hearing Disability
In terms of hearing disability, the demographic groups most similar to Australians are Bangladeshi (3.2%, a difference of 0.010%), Immigrants from Norway (3.2%, a difference of 0.25%), Russian (3.2%, a difference of 0.33%), Immigrants from Northern Europe (3.2%, a difference of 0.37%), and New Zealander (3.2%, a difference of 0.43%).
| Demographics | Rating | Rank | Hearing Disability |
| Hispanics or Latinos | 15.1 /100 | #207 | Poor 3.1% |
| Immigrants | Latvia | 12.7 /100 | #208 | Poor 3.1% |
| Immigrants | Hungary | 12.5 /100 | #209 | Poor 3.1% |
| Cape Verdeans | 12.2 /100 | #210 | Poor 3.1% |
| Romanians | 12.1 /100 | #211 | Poor 3.1% |
| Pakistanis | 11.1 /100 | #212 | Poor 3.1% |
| Immigrants | Iraq | 10.5 /100 | #213 | Poor 3.1% |
| Australians | 8.1 /100 | #214 | Tragic 3.2% |
| Bangladeshis | 8.1 /100 | #215 | Tragic 3.2% |
| Immigrants | Norway | 7.3 /100 | #216 | Tragic 3.2% |
| Russians | 7.1 /100 | #217 | Tragic 3.2% |
| Immigrants | Northern Europe | 7.0 /100 | #218 | Tragic 3.2% |
| New Zealanders | 6.8 /100 | #219 | Tragic 3.2% |
| Malaysians | 6.6 /100 | #220 | Tragic 3.2% |
| Immigrants | Laos | 6.6 /100 | #221 | Tragic 3.2% |