Immigrants from Sweden vs Argentinean Currently Married
COMPARE
Immigrants from Sweden
Argentinean
Currently Married
Currently Married Comparison
Immigrants from Sweden
Argentineans
47.8%
CURRENTLY MARRIED
94.3/ 100
METRIC RATING
99th/ 347
METRIC RANK
47.1%
CURRENTLY MARRIED
74.4/ 100
METRIC RATING
142nd/ 347
METRIC RANK
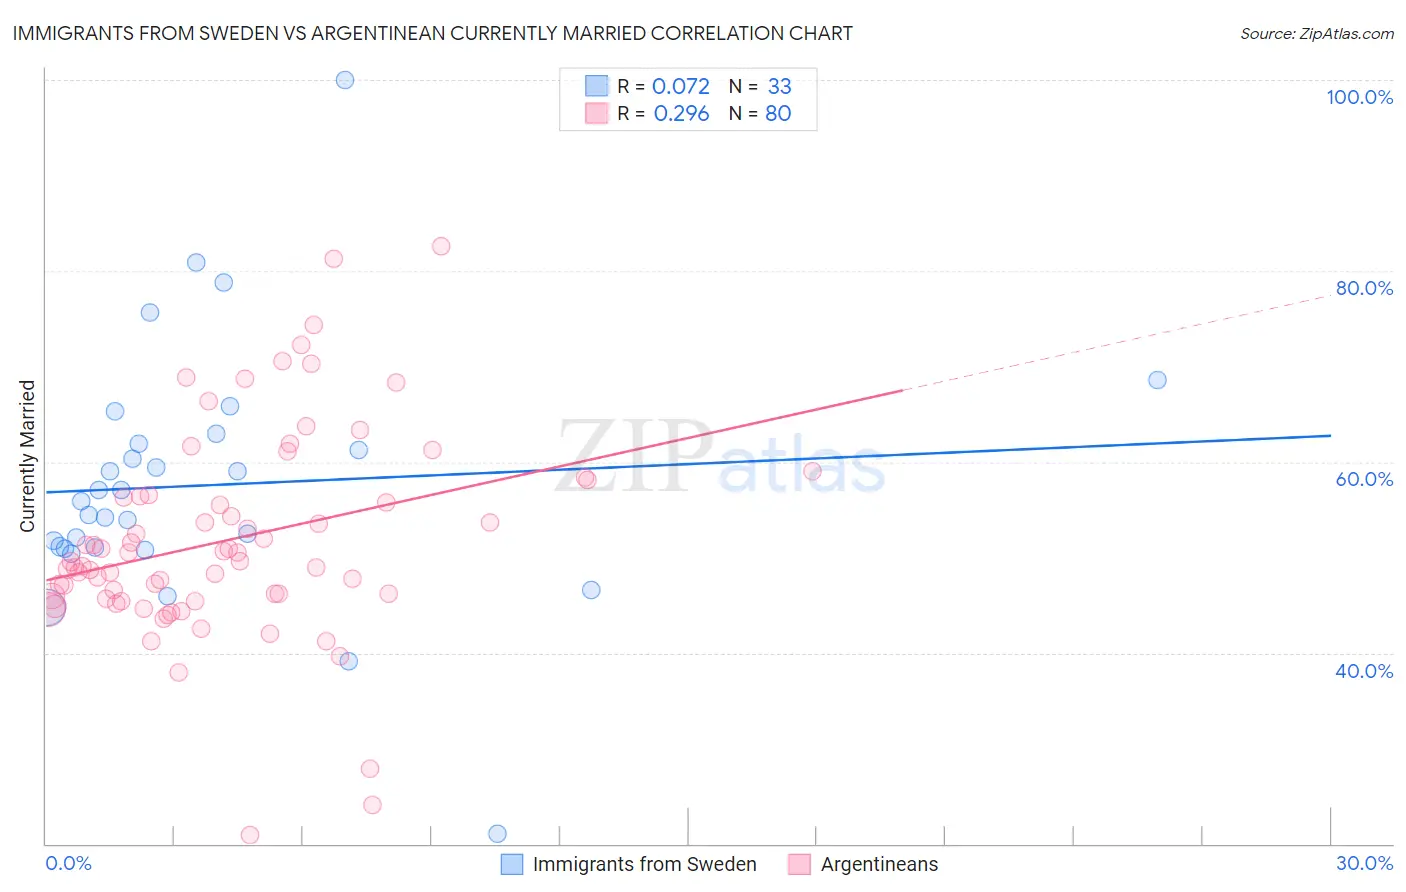
Immigrants from Sweden vs Argentinean Currently Married Correlation Chart
The statistical analysis conducted on geographies consisting of 164,728,408 people shows a slight positive correlation between the proportion of Immigrants from Sweden and percentage of population currently married in the United States with a correlation coefficient (R) of 0.072 and weighted average of 47.8%. Similarly, the statistical analysis conducted on geographies consisting of 297,105,288 people shows a weak positive correlation between the proportion of Argentineans and percentage of population currently married in the United States with a correlation coefficient (R) of 0.296 and weighted average of 47.1%, a difference of 1.6%.
Currently Married Correlation Summary
| Measurement | Immigrants from Sweden | Argentinean |
| Minimum | 21.1% | 20.9% |
| Maximum | 100.0% | 82.6% |
| Range | 78.9% | 61.7% |
| Mean | 57.6% | 51.8% |
| Median | 55.9% | 49.6% |
| Interquartile 25% (IQ1) | 51.0% | 45.8% |
| Interquartile 75% (IQ3) | 62.4% | 56.5% |
| Interquartile Range (IQR) | 11.5% | 10.7% |
| Standard Deviation (Sample) | 13.6% | 10.9% |
| Standard Deviation (Population) | 13.4% | 10.8% |
Similar Demographics by Currently Married
Demographics Similar to Immigrants from Sweden by Currently Married
In terms of currently married, the demographic groups most similar to Immigrants from Sweden are Celtic (47.8%, a difference of 0.020%), Immigrants from Germany (47.8%, a difference of 0.040%), Turkish (47.8%, a difference of 0.060%), Immigrants from China (47.9%, a difference of 0.080%), and Immigrants from Ukraine (47.9%, a difference of 0.090%).
| Demographics | Rating | Rank | Currently Married |
| Koreans | 95.4 /100 | #92 | Exceptional 47.9% |
| Lebanese | 95.1 /100 | #93 | Exceptional 47.9% |
| Native Hawaiians | 95.0 /100 | #94 | Exceptional 47.9% |
| Immigrants | Bulgaria | 94.8 /100 | #95 | Exceptional 47.9% |
| Egyptians | 94.8 /100 | #96 | Exceptional 47.9% |
| Immigrants | Ukraine | 94.8 /100 | #97 | Exceptional 47.9% |
| Immigrants | China | 94.7 /100 | #98 | Exceptional 47.9% |
| Immigrants | Sweden | 94.3 /100 | #99 | Exceptional 47.8% |
| Celtics | 94.2 /100 | #100 | Exceptional 47.8% |
| Immigrants | Germany | 94.1 /100 | #101 | Exceptional 47.8% |
| Turks | 93.9 /100 | #102 | Exceptional 47.8% |
| Cypriots | 93.7 /100 | #103 | Exceptional 47.8% |
| Serbians | 93.6 /100 | #104 | Exceptional 47.8% |
| Immigrants | Singapore | 93.3 /100 | #105 | Exceptional 47.8% |
| Immigrants | Greece | 93.1 /100 | #106 | Exceptional 47.7% |
Demographics Similar to Argentineans by Currently Married
In terms of currently married, the demographic groups most similar to Argentineans are Venezuelan (47.1%, a difference of 0.0%), Guamanian/Chamorro (47.1%, a difference of 0.010%), Cajun (47.1%, a difference of 0.040%), Hmong (47.1%, a difference of 0.040%), and Immigrants from South Eastern Asia (47.1%, a difference of 0.070%).
| Demographics | Rating | Rank | Currently Married |
| Immigrants | Norway | 79.7 /100 | #135 | Good 47.2% |
| Immigrants | Vietnam | 78.2 /100 | #136 | Good 47.2% |
| Paraguayans | 77.8 /100 | #137 | Good 47.2% |
| Pakistanis | 77.5 /100 | #138 | Good 47.2% |
| Yugoslavians | 77.4 /100 | #139 | Good 47.2% |
| Cajuns | 75.3 /100 | #140 | Good 47.1% |
| Venezuelans | 74.4 /100 | #141 | Good 47.1% |
| Argentineans | 74.4 /100 | #142 | Good 47.1% |
| Guamanians/Chamorros | 74.2 /100 | #143 | Good 47.1% |
| Hmong | 73.4 /100 | #144 | Good 47.1% |
| Immigrants | South Eastern Asia | 72.9 /100 | #145 | Good 47.1% |
| Carpatho Rusyns | 72.6 /100 | #146 | Good 47.0% |
| Immigrants | Argentina | 72.0 /100 | #147 | Good 47.0% |
| Cambodians | 70.4 /100 | #148 | Good 47.0% |
| Zimbabweans | 70.1 /100 | #149 | Good 47.0% |