Immigrants from Sweden vs Osage Currently Married
COMPARE
Immigrants from Sweden
Osage
Currently Married
Currently Married Comparison
Immigrants from Sweden
Osage
47.8%
CURRENTLY MARRIED
94.3/ 100
METRIC RATING
99th/ 347
METRIC RANK
47.5%
CURRENTLY MARRIED
87.9/ 100
METRIC RATING
122nd/ 347
METRIC RANK
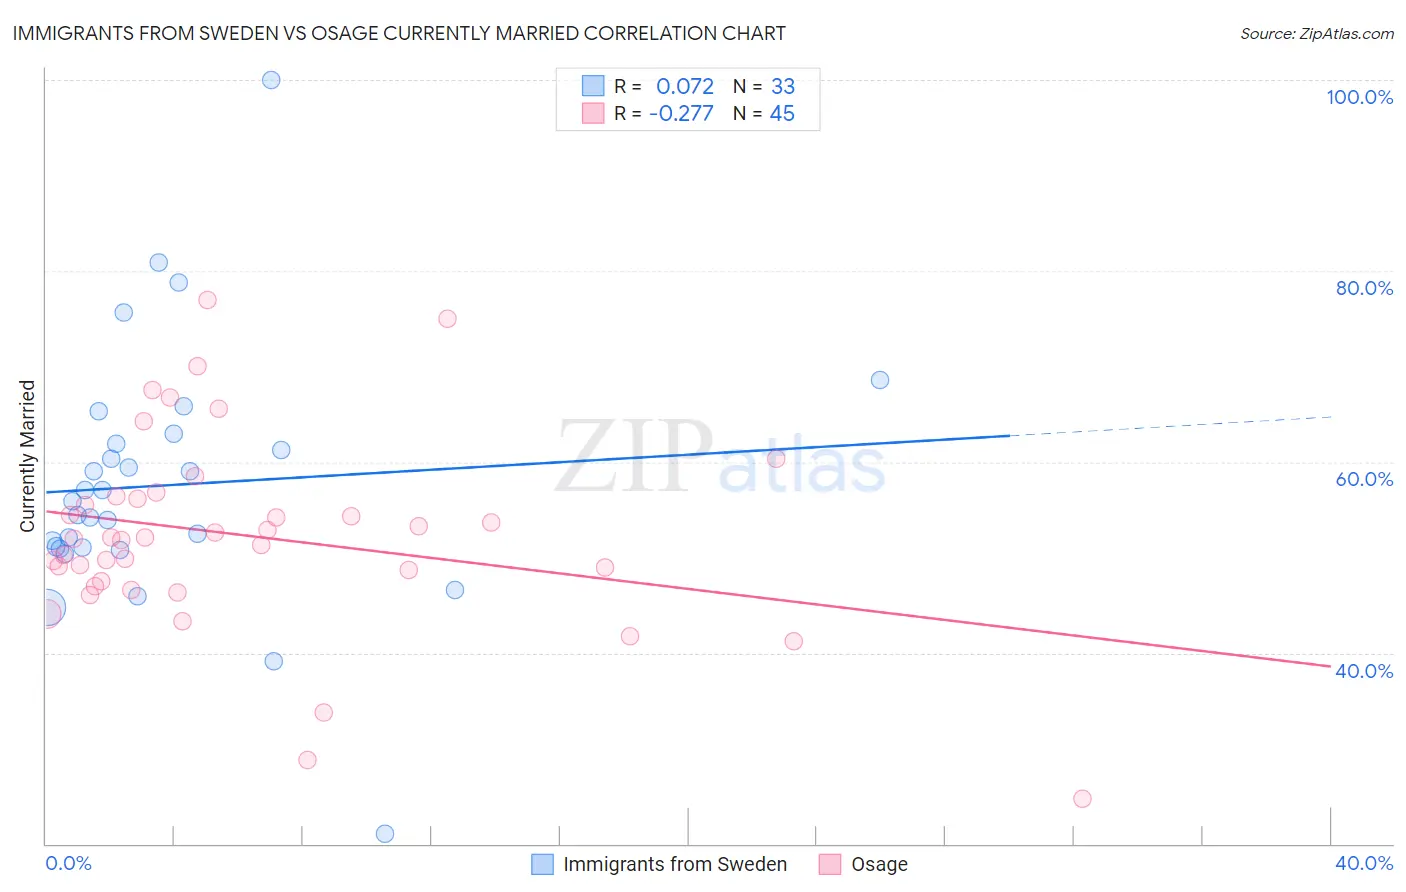
Immigrants from Sweden vs Osage Currently Married Correlation Chart
The statistical analysis conducted on geographies consisting of 164,728,408 people shows a slight positive correlation between the proportion of Immigrants from Sweden and percentage of population currently married in the United States with a correlation coefficient (R) of 0.072 and weighted average of 47.8%. Similarly, the statistical analysis conducted on geographies consisting of 91,806,752 people shows a weak negative correlation between the proportion of Osage and percentage of population currently married in the United States with a correlation coefficient (R) of -0.277 and weighted average of 47.5%, a difference of 0.73%.
Currently Married Correlation Summary
| Measurement | Immigrants from Sweden | Osage |
| Minimum | 21.1% | 24.7% |
| Maximum | 100.0% | 76.9% |
| Range | 78.9% | 52.2% |
| Mean | 57.6% | 52.2% |
| Median | 55.9% | 51.9% |
| Interquartile 25% (IQ1) | 51.0% | 47.2% |
| Interquartile 75% (IQ3) | 62.4% | 56.3% |
| Interquartile Range (IQR) | 11.5% | 9.1% |
| Standard Deviation (Sample) | 13.6% | 10.3% |
| Standard Deviation (Population) | 13.4% | 10.2% |
Similar Demographics by Currently Married
Demographics Similar to Immigrants from Sweden by Currently Married
In terms of currently married, the demographic groups most similar to Immigrants from Sweden are Celtic (47.8%, a difference of 0.020%), Immigrants from Germany (47.8%, a difference of 0.040%), Turkish (47.8%, a difference of 0.060%), Immigrants from China (47.9%, a difference of 0.080%), and Immigrants from Ukraine (47.9%, a difference of 0.090%).
| Demographics | Rating | Rank | Currently Married |
| Koreans | 95.4 /100 | #92 | Exceptional 47.9% |
| Lebanese | 95.1 /100 | #93 | Exceptional 47.9% |
| Native Hawaiians | 95.0 /100 | #94 | Exceptional 47.9% |
| Immigrants | Bulgaria | 94.8 /100 | #95 | Exceptional 47.9% |
| Egyptians | 94.8 /100 | #96 | Exceptional 47.9% |
| Immigrants | Ukraine | 94.8 /100 | #97 | Exceptional 47.9% |
| Immigrants | China | 94.7 /100 | #98 | Exceptional 47.9% |
| Immigrants | Sweden | 94.3 /100 | #99 | Exceptional 47.8% |
| Celtics | 94.2 /100 | #100 | Exceptional 47.8% |
| Immigrants | Germany | 94.1 /100 | #101 | Exceptional 47.8% |
| Turks | 93.9 /100 | #102 | Exceptional 47.8% |
| Cypriots | 93.7 /100 | #103 | Exceptional 47.8% |
| Serbians | 93.6 /100 | #104 | Exceptional 47.8% |
| Immigrants | Singapore | 93.3 /100 | #105 | Exceptional 47.8% |
| Immigrants | Greece | 93.1 /100 | #106 | Exceptional 47.7% |
Demographics Similar to Osage by Currently Married
In terms of currently married, the demographic groups most similar to Osage are Immigrants from Croatia (47.5%, a difference of 0.060%), Immigrants from Kazakhstan (47.4%, a difference of 0.060%), Syrian (47.5%, a difference of 0.090%), Laotian (47.4%, a difference of 0.11%), and Okinawan (47.4%, a difference of 0.20%).
| Demographics | Rating | Rank | Currently Married |
| Immigrants | Indonesia | 90.5 /100 | #115 | Exceptional 47.6% |
| Palestinians | 90.4 /100 | #116 | Exceptional 47.6% |
| Puget Sound Salish | 90.3 /100 | #117 | Exceptional 47.6% |
| Immigrants | Philippines | 90.2 /100 | #118 | Exceptional 47.6% |
| Australians | 90.2 /100 | #119 | Exceptional 47.6% |
| Syrians | 88.9 /100 | #120 | Excellent 47.5% |
| Immigrants | Croatia | 88.6 /100 | #121 | Excellent 47.5% |
| Osage | 87.9 /100 | #122 | Excellent 47.5% |
| Immigrants | Kazakhstan | 87.2 /100 | #123 | Excellent 47.4% |
| Laotians | 86.6 /100 | #124 | Excellent 47.4% |
| Okinawans | 85.3 /100 | #125 | Excellent 47.4% |
| Immigrants | Jordan | 84.9 /100 | #126 | Excellent 47.4% |
| New Zealanders | 84.9 /100 | #127 | Excellent 47.4% |
| Portuguese | 84.2 /100 | #128 | Excellent 47.3% |
| Sri Lankans | 83.2 /100 | #129 | Excellent 47.3% |