Scandinavian vs Argentinean Currently Married
COMPARE
Scandinavian
Argentinean
Currently Married
Currently Married Comparison
Scandinavians
Argentineans
49.5%
CURRENTLY MARRIED
99.9/ 100
METRIC RATING
17th/ 347
METRIC RANK
47.1%
CURRENTLY MARRIED
74.4/ 100
METRIC RATING
142nd/ 347
METRIC RANK
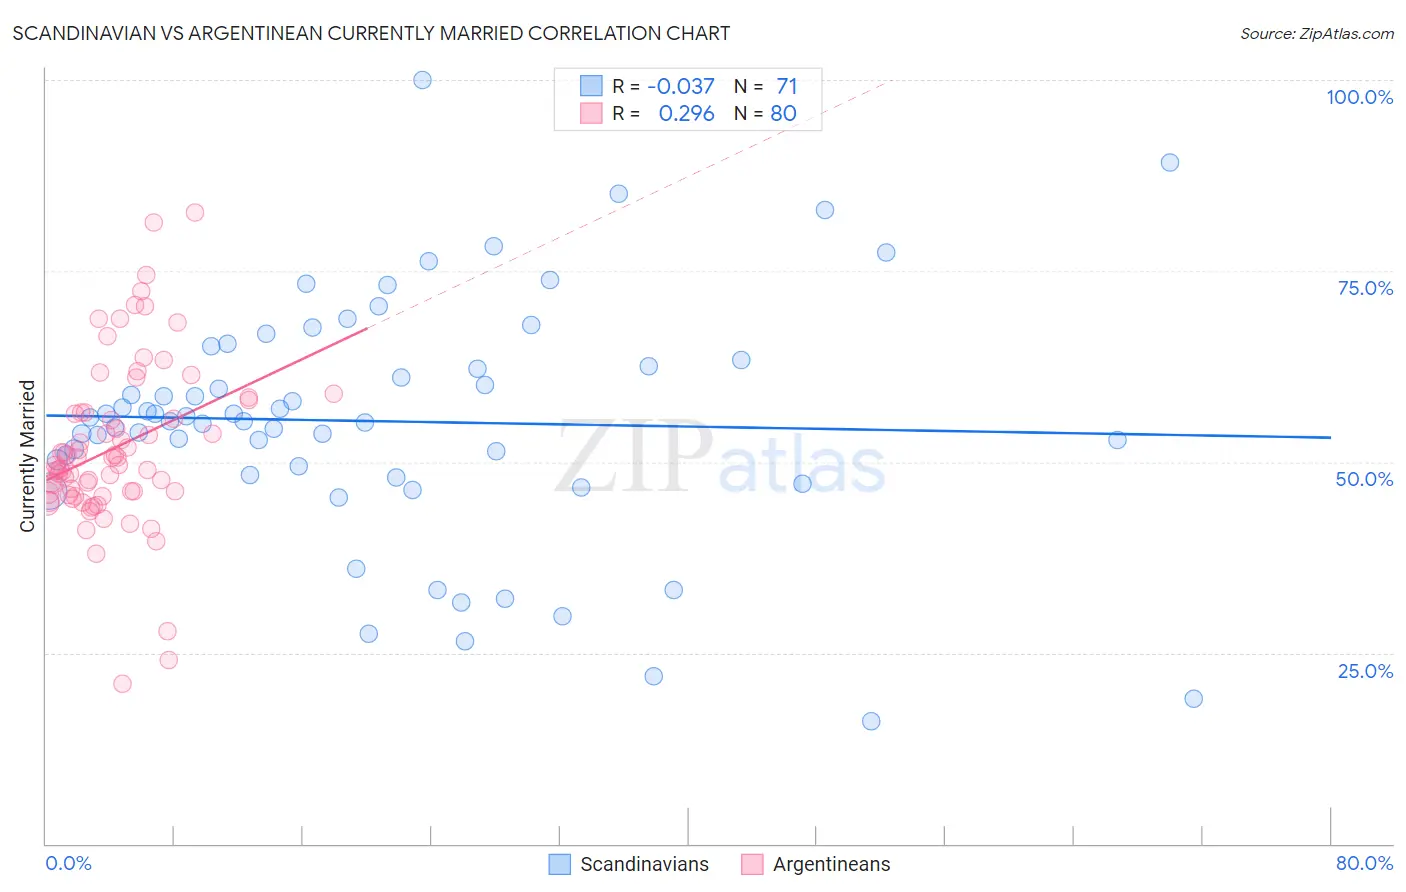
Scandinavian vs Argentinean Currently Married Correlation Chart
The statistical analysis conducted on geographies consisting of 472,583,978 people shows no correlation between the proportion of Scandinavians and percentage of population currently married in the United States with a correlation coefficient (R) of -0.037 and weighted average of 49.5%. Similarly, the statistical analysis conducted on geographies consisting of 297,105,288 people shows a weak positive correlation between the proportion of Argentineans and percentage of population currently married in the United States with a correlation coefficient (R) of 0.296 and weighted average of 47.1%, a difference of 5.1%.
Currently Married Correlation Summary
| Measurement | Scandinavian | Argentinean |
| Minimum | 16.0% | 20.9% |
| Maximum | 100.0% | 82.6% |
| Range | 84.0% | 61.7% |
| Mean | 55.3% | 51.8% |
| Median | 55.3% | 49.6% |
| Interquartile 25% (IQ1) | 48.3% | 45.8% |
| Interquartile 75% (IQ3) | 63.3% | 56.5% |
| Interquartile Range (IQR) | 15.0% | 10.7% |
| Standard Deviation (Sample) | 16.0% | 10.9% |
| Standard Deviation (Population) | 15.9% | 10.8% |
Similar Demographics by Currently Married
Demographics Similar to Scandinavians by Currently Married
In terms of currently married, the demographic groups most similar to Scandinavians are Chinese (49.5%, a difference of 0.020%), Pennsylvania German (49.6%, a difference of 0.16%), German (49.6%, a difference of 0.19%), Dutch (49.6%, a difference of 0.20%), and Immigrants from Scotland (49.3%, a difference of 0.29%).
| Demographics | Rating | Rank | Currently Married |
| Filipinos | 99.9 /100 | #10 | Exceptional 49.7% |
| English | 99.9 /100 | #11 | Exceptional 49.7% |
| Swiss | 99.9 /100 | #12 | Exceptional 49.7% |
| Dutch | 99.9 /100 | #13 | Exceptional 49.6% |
| Germans | 99.9 /100 | #14 | Exceptional 49.6% |
| Pennsylvania Germans | 99.9 /100 | #15 | Exceptional 49.6% |
| Chinese | 99.9 /100 | #16 | Exceptional 49.5% |
| Scandinavians | 99.9 /100 | #17 | Exceptional 49.5% |
| Immigrants | Scotland | 99.8 /100 | #18 | Exceptional 49.3% |
| Europeans | 99.8 /100 | #19 | Exceptional 49.3% |
| Luxembourgers | 99.8 /100 | #20 | Exceptional 49.3% |
| Scottish | 99.8 /100 | #21 | Exceptional 49.2% |
| Bulgarians | 99.7 /100 | #22 | Exceptional 49.1% |
| Immigrants | Pakistan | 99.7 /100 | #23 | Exceptional 49.1% |
| Lithuanians | 99.6 /100 | #24 | Exceptional 49.0% |
Demographics Similar to Argentineans by Currently Married
In terms of currently married, the demographic groups most similar to Argentineans are Venezuelan (47.1%, a difference of 0.0%), Guamanian/Chamorro (47.1%, a difference of 0.010%), Cajun (47.1%, a difference of 0.040%), Hmong (47.1%, a difference of 0.040%), and Immigrants from South Eastern Asia (47.1%, a difference of 0.070%).
| Demographics | Rating | Rank | Currently Married |
| Immigrants | Norway | 79.7 /100 | #135 | Good 47.2% |
| Immigrants | Vietnam | 78.2 /100 | #136 | Good 47.2% |
| Paraguayans | 77.8 /100 | #137 | Good 47.2% |
| Pakistanis | 77.5 /100 | #138 | Good 47.2% |
| Yugoslavians | 77.4 /100 | #139 | Good 47.2% |
| Cajuns | 75.3 /100 | #140 | Good 47.1% |
| Venezuelans | 74.4 /100 | #141 | Good 47.1% |
| Argentineans | 74.4 /100 | #142 | Good 47.1% |
| Guamanians/Chamorros | 74.2 /100 | #143 | Good 47.1% |
| Hmong | 73.4 /100 | #144 | Good 47.1% |
| Immigrants | South Eastern Asia | 72.9 /100 | #145 | Good 47.1% |
| Carpatho Rusyns | 72.6 /100 | #146 | Good 47.0% |
| Immigrants | Argentina | 72.0 /100 | #147 | Good 47.0% |
| Cambodians | 70.4 /100 | #148 | Good 47.0% |
| Zimbabweans | 70.1 /100 | #149 | Good 47.0% |