Cheyenne vs Argentinean Currently Married
COMPARE
Cheyenne
Argentinean
Currently Married
Currently Married Comparison
Cheyenne
Argentineans
42.2%
CURRENTLY MARRIED
0.0/ 100
METRIC RATING
297th/ 347
METRIC RANK
47.1%
CURRENTLY MARRIED
74.4/ 100
METRIC RATING
142nd/ 347
METRIC RANK
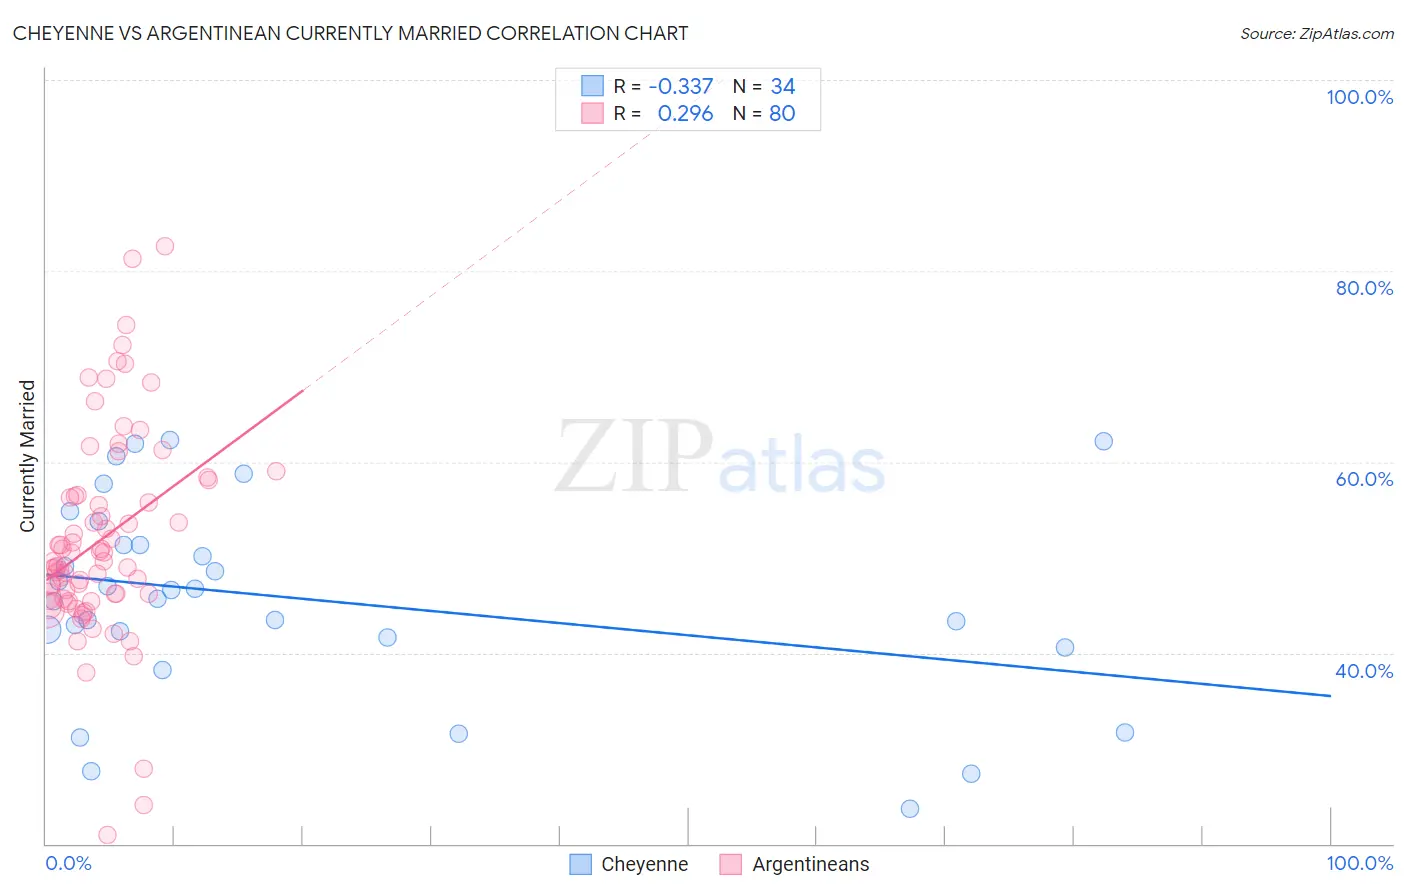
Cheyenne vs Argentinean Currently Married Correlation Chart
The statistical analysis conducted on geographies consisting of 80,721,070 people shows a mild negative correlation between the proportion of Cheyenne and percentage of population currently married in the United States with a correlation coefficient (R) of -0.337 and weighted average of 42.2%. Similarly, the statistical analysis conducted on geographies consisting of 297,105,288 people shows a weak positive correlation between the proportion of Argentineans and percentage of population currently married in the United States with a correlation coefficient (R) of 0.296 and weighted average of 47.1%, a difference of 11.5%.
Currently Married Correlation Summary
| Measurement | Cheyenne | Argentinean |
| Minimum | 23.7% | 20.9% |
| Maximum | 62.3% | 82.6% |
| Range | 38.6% | 61.7% |
| Mean | 45.6% | 51.8% |
| Median | 46.1% | 49.6% |
| Interquartile 25% (IQ1) | 41.6% | 45.8% |
| Interquartile 75% (IQ3) | 51.4% | 56.5% |
| Interquartile Range (IQR) | 9.8% | 10.7% |
| Standard Deviation (Sample) | 10.3% | 10.9% |
| Standard Deviation (Population) | 10.2% | 10.8% |
Similar Demographics by Currently Married
Demographics Similar to Cheyenne by Currently Married
In terms of currently married, the demographic groups most similar to Cheyenne are Immigrants from Honduras (42.2%, a difference of 0.090%), Menominee (42.3%, a difference of 0.11%), Liberian (42.2%, a difference of 0.12%), Belizean (42.2%, a difference of 0.22%), and Immigrants from Western Africa (42.4%, a difference of 0.31%).
| Demographics | Rating | Rank | Currently Married |
| Immigrants | Ghana | 0.0 /100 | #290 | Tragic 42.7% |
| Immigrants | Guatemala | 0.0 /100 | #291 | Tragic 42.6% |
| Sub-Saharan Africans | 0.0 /100 | #292 | Tragic 42.6% |
| Yuman | 0.0 /100 | #293 | Tragic 42.6% |
| Hondurans | 0.0 /100 | #294 | Tragic 42.5% |
| Immigrants | Western Africa | 0.0 /100 | #295 | Tragic 42.4% |
| Menominee | 0.0 /100 | #296 | Tragic 42.3% |
| Cheyenne | 0.0 /100 | #297 | Tragic 42.2% |
| Immigrants | Honduras | 0.0 /100 | #298 | Tragic 42.2% |
| Liberians | 0.0 /100 | #299 | Tragic 42.2% |
| Belizeans | 0.0 /100 | #300 | Tragic 42.2% |
| Immigrants | Yemen | 0.0 /100 | #301 | Tragic 42.1% |
| Immigrants | Zaire | 0.0 /100 | #302 | Tragic 42.0% |
| Sioux | 0.0 /100 | #303 | Tragic 41.9% |
| Immigrants | Bahamas | 0.0 /100 | #304 | Tragic 41.9% |
Demographics Similar to Argentineans by Currently Married
In terms of currently married, the demographic groups most similar to Argentineans are Venezuelan (47.1%, a difference of 0.0%), Guamanian/Chamorro (47.1%, a difference of 0.010%), Cajun (47.1%, a difference of 0.040%), Hmong (47.1%, a difference of 0.040%), and Immigrants from South Eastern Asia (47.1%, a difference of 0.070%).
| Demographics | Rating | Rank | Currently Married |
| Immigrants | Norway | 79.7 /100 | #135 | Good 47.2% |
| Immigrants | Vietnam | 78.2 /100 | #136 | Good 47.2% |
| Paraguayans | 77.8 /100 | #137 | Good 47.2% |
| Pakistanis | 77.5 /100 | #138 | Good 47.2% |
| Yugoslavians | 77.4 /100 | #139 | Good 47.2% |
| Cajuns | 75.3 /100 | #140 | Good 47.1% |
| Venezuelans | 74.4 /100 | #141 | Good 47.1% |
| Argentineans | 74.4 /100 | #142 | Good 47.1% |
| Guamanians/Chamorros | 74.2 /100 | #143 | Good 47.1% |
| Hmong | 73.4 /100 | #144 | Good 47.1% |
| Immigrants | South Eastern Asia | 72.9 /100 | #145 | Good 47.1% |
| Carpatho Rusyns | 72.6 /100 | #146 | Good 47.0% |
| Immigrants | Argentina | 72.0 /100 | #147 | Good 47.0% |
| Cambodians | 70.4 /100 | #148 | Good 47.0% |
| Zimbabweans | 70.1 /100 | #149 | Good 47.0% |