Immigrants from Eastern Asia vs Argentinean Currently Married
COMPARE
Immigrants from Eastern Asia
Argentinean
Currently Married
Currently Married Comparison
Immigrants from Eastern Asia
Argentineans
48.2%
CURRENTLY MARRIED
97.5/ 100
METRIC RATING
73rd/ 347
METRIC RANK
47.1%
CURRENTLY MARRIED
74.4/ 100
METRIC RATING
142nd/ 347
METRIC RANK
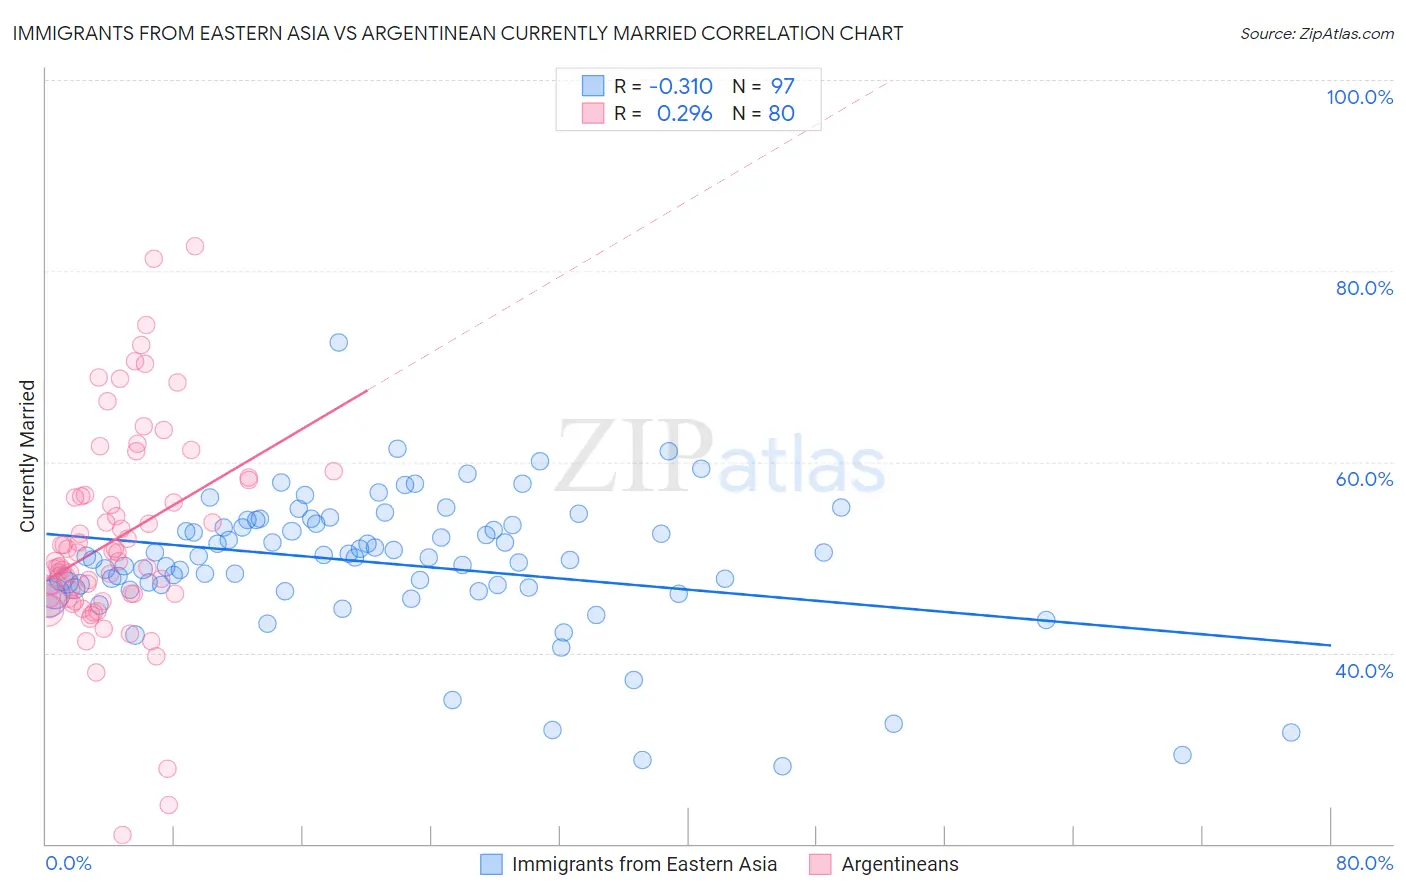
Immigrants from Eastern Asia vs Argentinean Currently Married Correlation Chart
The statistical analysis conducted on geographies consisting of 499,820,876 people shows a mild negative correlation between the proportion of Immigrants from Eastern Asia and percentage of population currently married in the United States with a correlation coefficient (R) of -0.310 and weighted average of 48.2%. Similarly, the statistical analysis conducted on geographies consisting of 297,105,288 people shows a weak positive correlation between the proportion of Argentineans and percentage of population currently married in the United States with a correlation coefficient (R) of 0.296 and weighted average of 47.1%, a difference of 2.4%.
Currently Married Correlation Summary
| Measurement | Immigrants from Eastern Asia | Argentinean |
| Minimum | 28.1% | 20.9% |
| Maximum | 72.5% | 82.6% |
| Range | 44.4% | 61.7% |
| Mean | 49.4% | 51.8% |
| Median | 50.0% | 49.6% |
| Interquartile 25% (IQ1) | 46.8% | 45.8% |
| Interquartile 75% (IQ3) | 53.5% | 56.5% |
| Interquartile Range (IQR) | 6.7% | 10.7% |
| Standard Deviation (Sample) | 7.2% | 10.9% |
| Standard Deviation (Population) | 7.2% | 10.8% |
Similar Demographics by Currently Married
Demographics Similar to Immigrants from Eastern Asia by Currently Married
In terms of currently married, the demographic groups most similar to Immigrants from Eastern Asia are Immigrants from Lebanon (48.2%, a difference of 0.020%), Estonian (48.2%, a difference of 0.030%), Immigrants from Belarus (48.1%, a difference of 0.10%), Basque (48.1%, a difference of 0.12%), and Slovene (48.1%, a difference of 0.14%).
| Demographics | Rating | Rank | Currently Married |
| Tongans | 98.2 /100 | #66 | Exceptional 48.3% |
| Slovaks | 98.2 /100 | #67 | Exceptional 48.3% |
| Immigrants | England | 98.2 /100 | #68 | Exceptional 48.3% |
| Canadians | 98.1 /100 | #69 | Exceptional 48.3% |
| Immigrants | Asia | 97.9 /100 | #70 | Exceptional 48.3% |
| Macedonians | 97.9 /100 | #71 | Exceptional 48.3% |
| Immigrants | Lebanon | 97.6 /100 | #72 | Exceptional 48.2% |
| Immigrants | Eastern Asia | 97.5 /100 | #73 | Exceptional 48.2% |
| Estonians | 97.4 /100 | #74 | Exceptional 48.2% |
| Immigrants | Belarus | 97.2 /100 | #75 | Exceptional 48.1% |
| Basques | 97.2 /100 | #76 | Exceptional 48.1% |
| Slovenes | 97.1 /100 | #77 | Exceptional 48.1% |
| Immigrants | Belgium | 97.1 /100 | #78 | Exceptional 48.1% |
| Immigrants | South Africa | 97.0 /100 | #79 | Exceptional 48.1% |
| Immigrants | Poland | 96.9 /100 | #80 | Exceptional 48.1% |
Demographics Similar to Argentineans by Currently Married
In terms of currently married, the demographic groups most similar to Argentineans are Venezuelan (47.1%, a difference of 0.0%), Guamanian/Chamorro (47.1%, a difference of 0.010%), Cajun (47.1%, a difference of 0.040%), Hmong (47.1%, a difference of 0.040%), and Immigrants from South Eastern Asia (47.1%, a difference of 0.070%).
| Demographics | Rating | Rank | Currently Married |
| Immigrants | Norway | 79.7 /100 | #135 | Good 47.2% |
| Immigrants | Vietnam | 78.2 /100 | #136 | Good 47.2% |
| Paraguayans | 77.8 /100 | #137 | Good 47.2% |
| Pakistanis | 77.5 /100 | #138 | Good 47.2% |
| Yugoslavians | 77.4 /100 | #139 | Good 47.2% |
| Cajuns | 75.3 /100 | #140 | Good 47.1% |
| Venezuelans | 74.4 /100 | #141 | Good 47.1% |
| Argentineans | 74.4 /100 | #142 | Good 47.1% |
| Guamanians/Chamorros | 74.2 /100 | #143 | Good 47.1% |
| Hmong | 73.4 /100 | #144 | Good 47.1% |
| Immigrants | South Eastern Asia | 72.9 /100 | #145 | Good 47.1% |
| Carpatho Rusyns | 72.6 /100 | #146 | Good 47.0% |
| Immigrants | Argentina | 72.0 /100 | #147 | Good 47.0% |
| Cambodians | 70.4 /100 | #148 | Good 47.0% |
| Zimbabweans | 70.1 /100 | #149 | Good 47.0% |