Immigrants from Sweden vs Thai Currently Married
COMPARE
Immigrants from Sweden
Thai
Currently Married
Currently Married Comparison
Immigrants from Sweden
Thais
47.8%
CURRENTLY MARRIED
94.3/ 100
METRIC RATING
99th/ 347
METRIC RANK
50.9%
CURRENTLY MARRIED
100.0/ 100
METRIC RATING
2nd/ 347
METRIC RANK
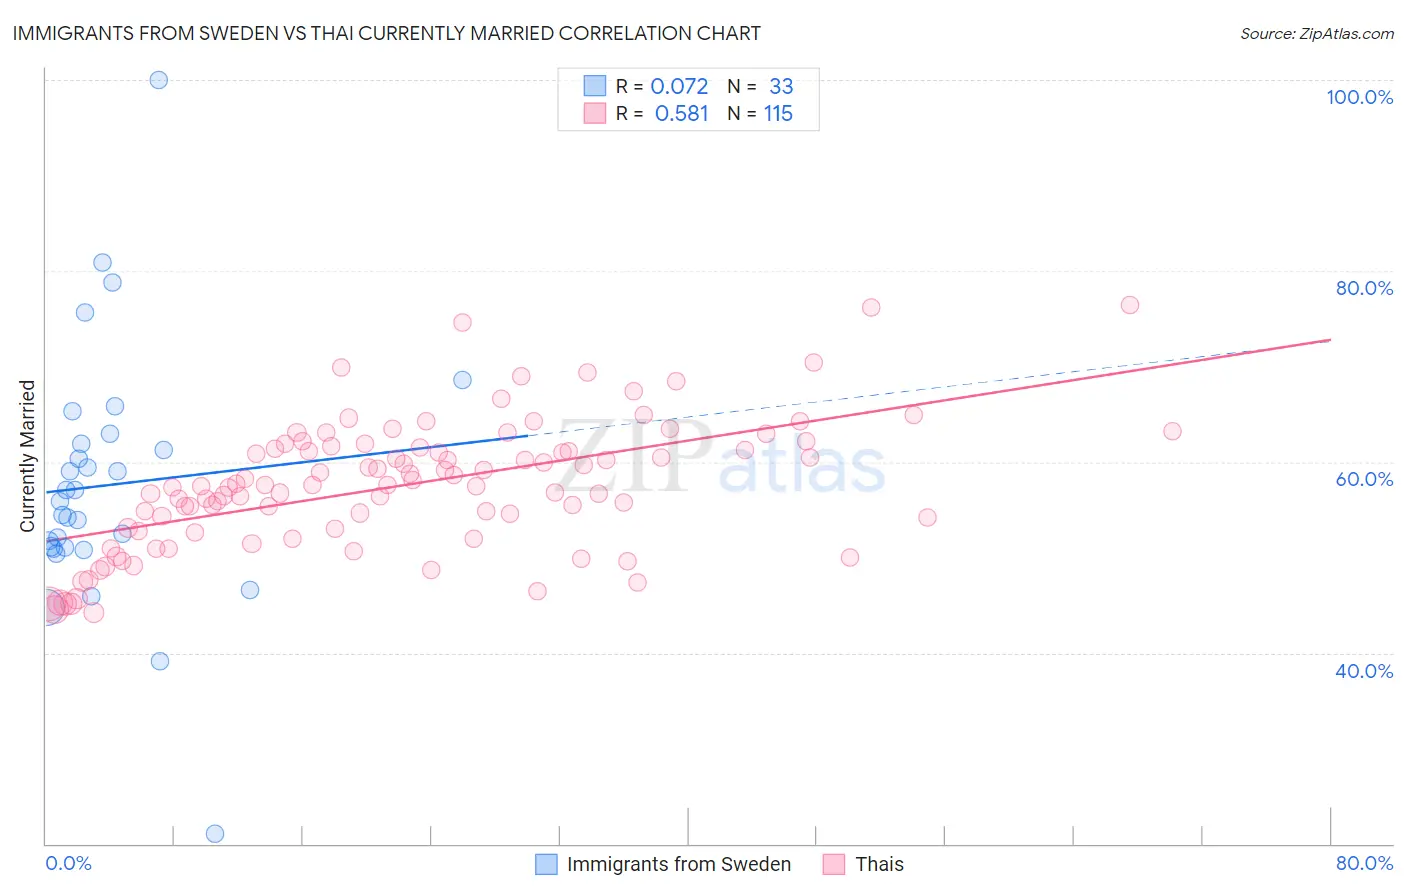
Immigrants from Sweden vs Thai Currently Married Correlation Chart
The statistical analysis conducted on geographies consisting of 164,728,408 people shows a slight positive correlation between the proportion of Immigrants from Sweden and percentage of population currently married in the United States with a correlation coefficient (R) of 0.072 and weighted average of 47.8%. Similarly, the statistical analysis conducted on geographies consisting of 475,756,416 people shows a substantial positive correlation between the proportion of Thais and percentage of population currently married in the United States with a correlation coefficient (R) of 0.581 and weighted average of 50.9%, a difference of 6.4%.
Currently Married Correlation Summary
| Measurement | Immigrants from Sweden | Thai |
| Minimum | 21.1% | 44.3% |
| Maximum | 100.0% | 76.4% |
| Range | 78.9% | 32.1% |
| Mean | 57.6% | 57.5% |
| Median | 55.9% | 57.5% |
| Interquartile 25% (IQ1) | 51.0% | 52.8% |
| Interquartile 75% (IQ3) | 62.4% | 61.5% |
| Interquartile Range (IQR) | 11.5% | 8.7% |
| Standard Deviation (Sample) | 13.6% | 6.8% |
| Standard Deviation (Population) | 13.4% | 6.8% |
Similar Demographics by Currently Married
Demographics Similar to Immigrants from Sweden by Currently Married
In terms of currently married, the demographic groups most similar to Immigrants from Sweden are Celtic (47.8%, a difference of 0.020%), Immigrants from Germany (47.8%, a difference of 0.040%), Turkish (47.8%, a difference of 0.060%), Immigrants from China (47.9%, a difference of 0.080%), and Immigrants from Ukraine (47.9%, a difference of 0.090%).
| Demographics | Rating | Rank | Currently Married |
| Koreans | 95.4 /100 | #92 | Exceptional 47.9% |
| Lebanese | 95.1 /100 | #93 | Exceptional 47.9% |
| Native Hawaiians | 95.0 /100 | #94 | Exceptional 47.9% |
| Immigrants | Bulgaria | 94.8 /100 | #95 | Exceptional 47.9% |
| Egyptians | 94.8 /100 | #96 | Exceptional 47.9% |
| Immigrants | Ukraine | 94.8 /100 | #97 | Exceptional 47.9% |
| Immigrants | China | 94.7 /100 | #98 | Exceptional 47.9% |
| Immigrants | Sweden | 94.3 /100 | #99 | Exceptional 47.8% |
| Celtics | 94.2 /100 | #100 | Exceptional 47.8% |
| Immigrants | Germany | 94.1 /100 | #101 | Exceptional 47.8% |
| Turks | 93.9 /100 | #102 | Exceptional 47.8% |
| Cypriots | 93.7 /100 | #103 | Exceptional 47.8% |
| Serbians | 93.6 /100 | #104 | Exceptional 47.8% |
| Immigrants | Singapore | 93.3 /100 | #105 | Exceptional 47.8% |
| Immigrants | Greece | 93.1 /100 | #106 | Exceptional 47.7% |
Demographics Similar to Thais by Currently Married
In terms of currently married, the demographic groups most similar to Thais are Assyrian/Chaldean/Syriac (50.8%, a difference of 0.18%), Immigrants from Taiwan (50.7%, a difference of 0.26%), Danish (50.5%, a difference of 0.81%), Norwegian (50.2%, a difference of 1.4%), and Immigrants from South Central Asia (50.0%, a difference of 1.7%).
| Demographics | Rating | Rank | Currently Married |
| Immigrants | India | 100.0 /100 | #1 | Exceptional 51.8% |
| Thais | 100.0 /100 | #2 | Exceptional 50.9% |
| Assyrians/Chaldeans/Syriacs | 100.0 /100 | #3 | Exceptional 50.8% |
| Immigrants | Taiwan | 100.0 /100 | #4 | Exceptional 50.7% |
| Danes | 100.0 /100 | #5 | Exceptional 50.5% |
| Norwegians | 100.0 /100 | #6 | Exceptional 50.2% |
| Immigrants | South Central Asia | 100.0 /100 | #7 | Exceptional 50.0% |
| Swedes | 100.0 /100 | #8 | Exceptional 50.0% |
| Czechs | 99.9 /100 | #9 | Exceptional 49.9% |
| Filipinos | 99.9 /100 | #10 | Exceptional 49.7% |
| English | 99.9 /100 | #11 | Exceptional 49.7% |
| Swiss | 99.9 /100 | #12 | Exceptional 49.7% |
| Dutch | 99.9 /100 | #13 | Exceptional 49.6% |
| Germans | 99.9 /100 | #14 | Exceptional 49.6% |
| Pennsylvania Germans | 99.9 /100 | #15 | Exceptional 49.6% |