Immigrants from Costa Rica vs Argentinean Currently Married
COMPARE
Immigrants from Costa Rica
Argentinean
Currently Married
Currently Married Comparison
Immigrants from Costa Rica
Argentineans
46.0%
CURRENTLY MARRIED
19.6/ 100
METRIC RATING
199th/ 347
METRIC RANK
47.1%
CURRENTLY MARRIED
74.4/ 100
METRIC RATING
142nd/ 347
METRIC RANK
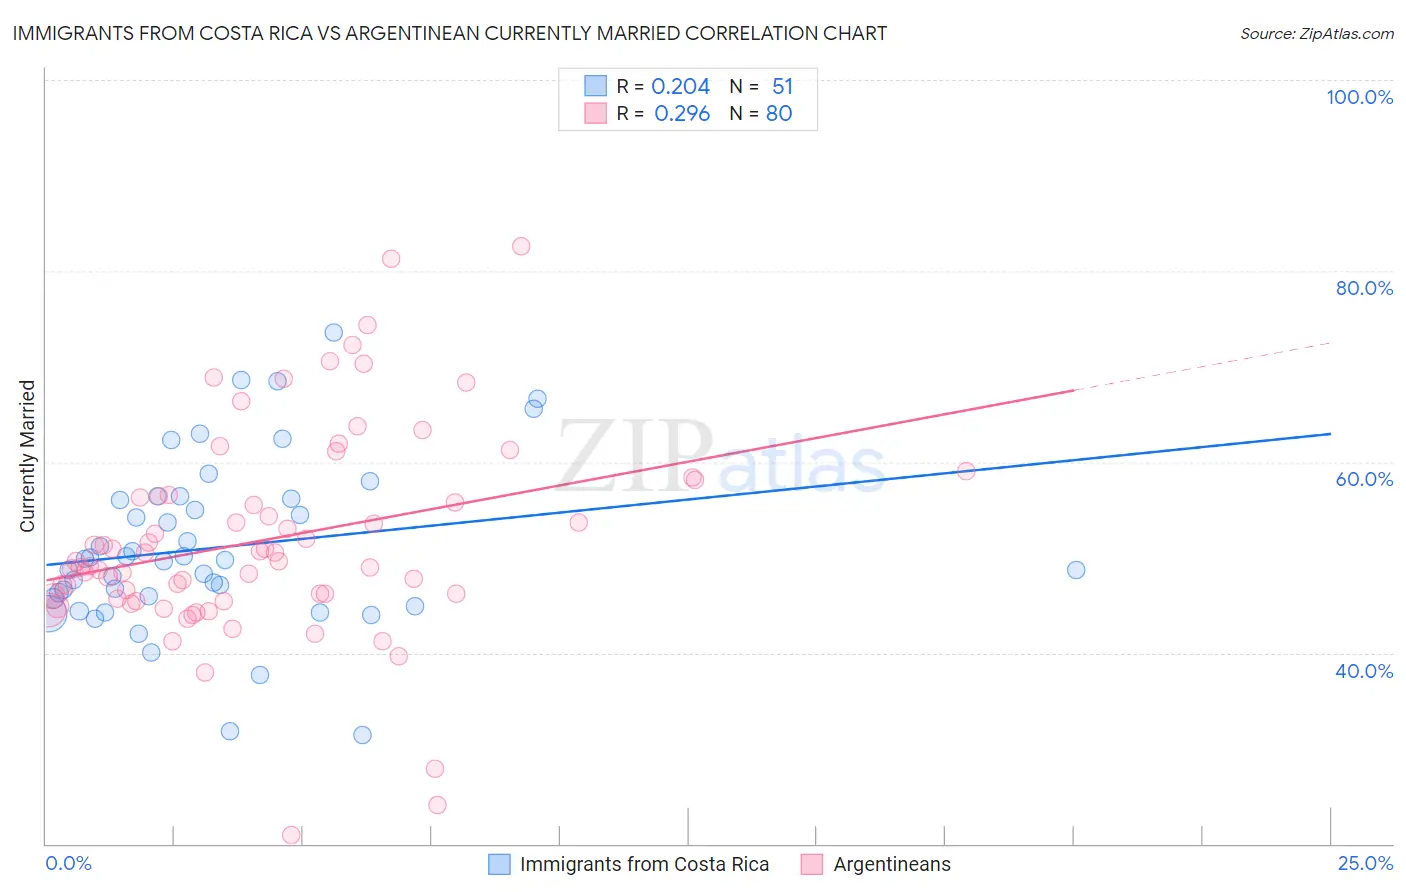
Immigrants from Costa Rica vs Argentinean Currently Married Correlation Chart
The statistical analysis conducted on geographies consisting of 204,268,650 people shows a weak positive correlation between the proportion of Immigrants from Costa Rica and percentage of population currently married in the United States with a correlation coefficient (R) of 0.204 and weighted average of 46.0%. Similarly, the statistical analysis conducted on geographies consisting of 297,105,288 people shows a weak positive correlation between the proportion of Argentineans and percentage of population currently married in the United States with a correlation coefficient (R) of 0.296 and weighted average of 47.1%, a difference of 2.3%.
Currently Married Correlation Summary
| Measurement | Immigrants from Costa Rica | Argentinean |
| Minimum | 31.4% | 20.9% |
| Maximum | 73.5% | 82.6% |
| Range | 42.1% | 61.7% |
| Mean | 51.0% | 51.8% |
| Median | 49.7% | 49.6% |
| Interquartile 25% (IQ1) | 45.7% | 45.8% |
| Interquartile 75% (IQ3) | 56.1% | 56.5% |
| Interquartile Range (IQR) | 10.4% | 10.7% |
| Standard Deviation (Sample) | 8.8% | 10.9% |
| Standard Deviation (Population) | 8.7% | 10.8% |
Similar Demographics by Currently Married
Demographics Similar to Immigrants from Costa Rica by Currently Married
In terms of currently married, the demographic groups most similar to Immigrants from Costa Rica are Immigrants from Colombia (46.1%, a difference of 0.080%), Immigrants from Kuwait (46.1%, a difference of 0.12%), Creek (46.0%, a difference of 0.14%), Immigrants from Bosnia and Herzegovina (46.1%, a difference of 0.15%), and South American (46.1%, a difference of 0.23%).
| Demographics | Rating | Rank | Currently Married |
| Soviet Union | 25.7 /100 | #192 | Fair 46.2% |
| Immigrants | Fiji | 25.0 /100 | #193 | Fair 46.2% |
| South Americans | 23.8 /100 | #194 | Fair 46.1% |
| Immigrants | Nepal | 23.7 /100 | #195 | Fair 46.1% |
| Immigrants | Bosnia and Herzegovina | 22.2 /100 | #196 | Fair 46.1% |
| Immigrants | Kuwait | 21.7 /100 | #197 | Fair 46.1% |
| Immigrants | Colombia | 21.0 /100 | #198 | Fair 46.1% |
| Immigrants | Costa Rica | 19.6 /100 | #199 | Poor 46.0% |
| Creek | 17.2 /100 | #200 | Poor 46.0% |
| Malaysians | 15.3 /100 | #201 | Poor 45.9% |
| Immigrants | Albania | 14.5 /100 | #202 | Poor 45.9% |
| Taiwanese | 11.7 /100 | #203 | Poor 45.8% |
| Immigrants | Spain | 11.6 /100 | #204 | Poor 45.8% |
| South American Indians | 11.5 /100 | #205 | Poor 45.8% |
| Immigrants | Immigrants | 11.2 /100 | #206 | Poor 45.8% |
Demographics Similar to Argentineans by Currently Married
In terms of currently married, the demographic groups most similar to Argentineans are Venezuelan (47.1%, a difference of 0.0%), Guamanian/Chamorro (47.1%, a difference of 0.010%), Cajun (47.1%, a difference of 0.040%), Hmong (47.1%, a difference of 0.040%), and Immigrants from South Eastern Asia (47.1%, a difference of 0.070%).
| Demographics | Rating | Rank | Currently Married |
| Immigrants | Norway | 79.7 /100 | #135 | Good 47.2% |
| Immigrants | Vietnam | 78.2 /100 | #136 | Good 47.2% |
| Paraguayans | 77.8 /100 | #137 | Good 47.2% |
| Pakistanis | 77.5 /100 | #138 | Good 47.2% |
| Yugoslavians | 77.4 /100 | #139 | Good 47.2% |
| Cajuns | 75.3 /100 | #140 | Good 47.1% |
| Venezuelans | 74.4 /100 | #141 | Good 47.1% |
| Argentineans | 74.4 /100 | #142 | Good 47.1% |
| Guamanians/Chamorros | 74.2 /100 | #143 | Good 47.1% |
| Hmong | 73.4 /100 | #144 | Good 47.1% |
| Immigrants | South Eastern Asia | 72.9 /100 | #145 | Good 47.1% |
| Carpatho Rusyns | 72.6 /100 | #146 | Good 47.0% |
| Immigrants | Argentina | 72.0 /100 | #147 | Good 47.0% |
| Cambodians | 70.4 /100 | #148 | Good 47.0% |
| Zimbabweans | 70.1 /100 | #149 | Good 47.0% |