Comanche vs Argentinean Currently Married
COMPARE
Comanche
Argentinean
Currently Married
Currently Married Comparison
Comanche
Argentineans
45.0%
CURRENTLY MARRIED
2.1/ 100
METRIC RATING
226th/ 347
METRIC RANK
47.1%
CURRENTLY MARRIED
74.4/ 100
METRIC RATING
142nd/ 347
METRIC RANK
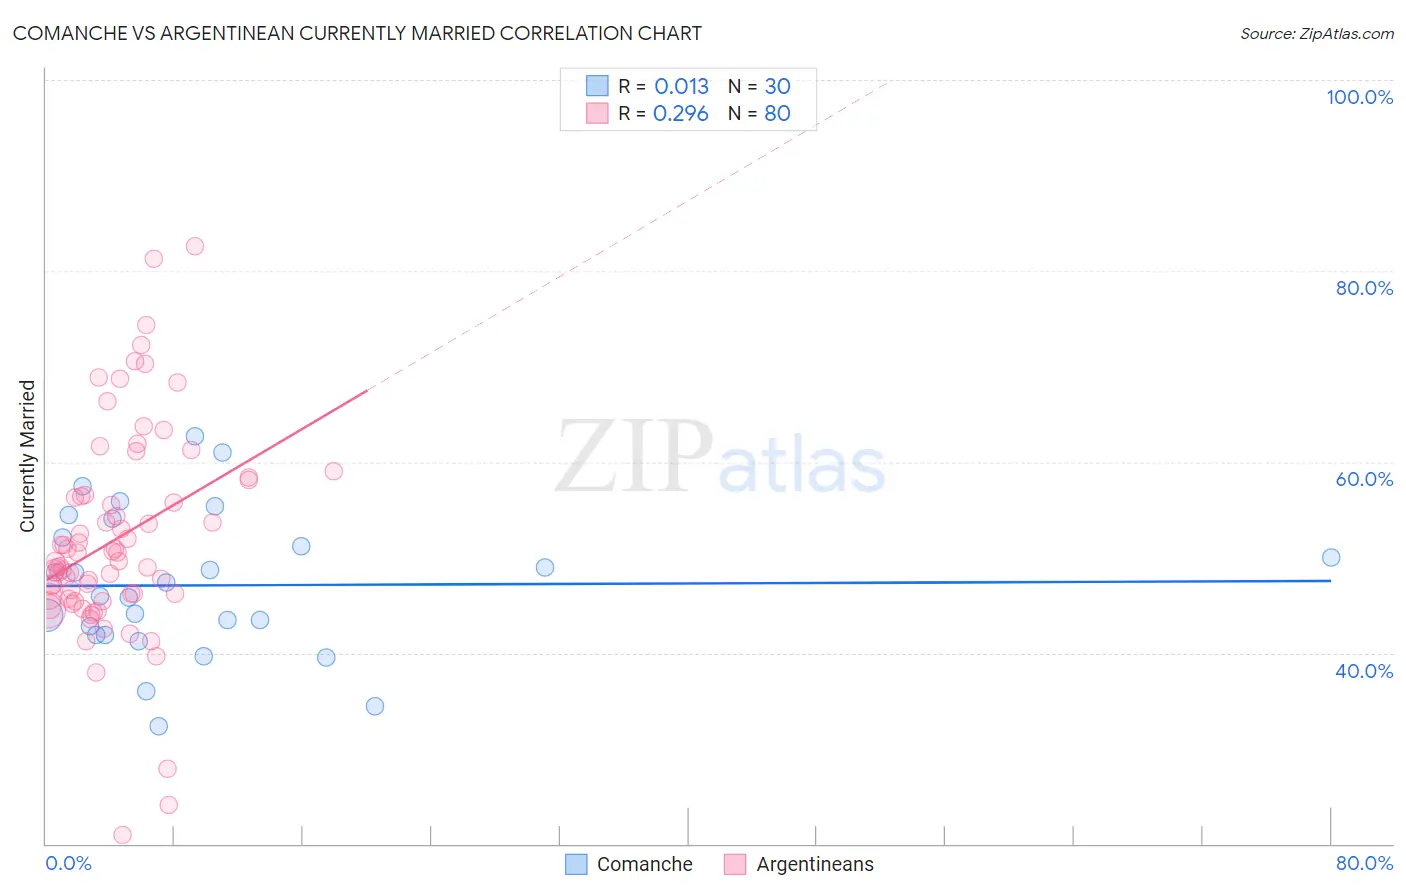
Comanche vs Argentinean Currently Married Correlation Chart
The statistical analysis conducted on geographies consisting of 109,782,091 people shows no correlation between the proportion of Comanche and percentage of population currently married in the United States with a correlation coefficient (R) of 0.013 and weighted average of 45.0%. Similarly, the statistical analysis conducted on geographies consisting of 297,105,288 people shows a weak positive correlation between the proportion of Argentineans and percentage of population currently married in the United States with a correlation coefficient (R) of 0.296 and weighted average of 47.1%, a difference of 4.7%.
Currently Married Correlation Summary
| Measurement | Comanche | Argentinean |
| Minimum | 32.3% | 20.9% |
| Maximum | 62.7% | 82.6% |
| Range | 30.4% | 61.7% |
| Mean | 47.1% | 51.8% |
| Median | 46.6% | 49.6% |
| Interquartile 25% (IQ1) | 41.8% | 45.8% |
| Interquartile 75% (IQ3) | 52.1% | 56.5% |
| Interquartile Range (IQR) | 10.2% | 10.7% |
| Standard Deviation (Sample) | 7.5% | 10.9% |
| Standard Deviation (Population) | 7.4% | 10.8% |
Similar Demographics by Currently Married
Demographics Similar to Comanche by Currently Married
In terms of currently married, the demographic groups most similar to Comanche are Spanish American (45.0%, a difference of 0.0%), Immigrants from Uruguay (45.0%, a difference of 0.010%), Immigrants from Uganda (45.0%, a difference of 0.050%), French American Indian (45.0%, a difference of 0.050%), and Immigrants from Laos (45.0%, a difference of 0.10%).
| Demographics | Rating | Rank | Currently Married |
| Immigrants | Portugal | 3.5 /100 | #219 | Tragic 45.2% |
| Kenyans | 3.1 /100 | #220 | Tragic 45.2% |
| Mexicans | 3.0 /100 | #221 | Tragic 45.2% |
| Immigrants | Azores | 2.5 /100 | #222 | Tragic 45.1% |
| Immigrants | Laos | 2.3 /100 | #223 | Tragic 45.0% |
| Immigrants | Uganda | 2.2 /100 | #224 | Tragic 45.0% |
| French American Indians | 2.2 /100 | #225 | Tragic 45.0% |
| Comanche | 2.1 /100 | #226 | Tragic 45.0% |
| Spanish Americans | 2.1 /100 | #227 | Tragic 45.0% |
| Immigrants | Uruguay | 2.0 /100 | #228 | Tragic 45.0% |
| Cree | 1.7 /100 | #229 | Tragic 44.9% |
| Immigrants | Kenya | 1.6 /100 | #230 | Tragic 44.9% |
| Immigrants | Panama | 1.5 /100 | #231 | Tragic 44.9% |
| Nepalese | 1.2 /100 | #232 | Tragic 44.7% |
| Immigrants | Saudi Arabia | 1.1 /100 | #233 | Tragic 44.7% |
Demographics Similar to Argentineans by Currently Married
In terms of currently married, the demographic groups most similar to Argentineans are Venezuelan (47.1%, a difference of 0.0%), Guamanian/Chamorro (47.1%, a difference of 0.010%), Cajun (47.1%, a difference of 0.040%), Hmong (47.1%, a difference of 0.040%), and Immigrants from South Eastern Asia (47.1%, a difference of 0.070%).
| Demographics | Rating | Rank | Currently Married |
| Immigrants | Norway | 79.7 /100 | #135 | Good 47.2% |
| Immigrants | Vietnam | 78.2 /100 | #136 | Good 47.2% |
| Paraguayans | 77.8 /100 | #137 | Good 47.2% |
| Pakistanis | 77.5 /100 | #138 | Good 47.2% |
| Yugoslavians | 77.4 /100 | #139 | Good 47.2% |
| Cajuns | 75.3 /100 | #140 | Good 47.1% |
| Venezuelans | 74.4 /100 | #141 | Good 47.1% |
| Argentineans | 74.4 /100 | #142 | Good 47.1% |
| Guamanians/Chamorros | 74.2 /100 | #143 | Good 47.1% |
| Hmong | 73.4 /100 | #144 | Good 47.1% |
| Immigrants | South Eastern Asia | 72.9 /100 | #145 | Good 47.1% |
| Carpatho Rusyns | 72.6 /100 | #146 | Good 47.0% |
| Immigrants | Argentina | 72.0 /100 | #147 | Good 47.0% |
| Cambodians | 70.4 /100 | #148 | Good 47.0% |
| Zimbabweans | 70.1 /100 | #149 | Good 47.0% |