Burmese vs Jamaican Married-couple Households
COMPARE
Burmese
Jamaican
Married-couple Households
Married-couple Households Comparison
Burmese
Jamaicans
49.8%
MARRIED-COUPLE HOUSEHOLDS
100.0/ 100
METRIC RATING
14th/ 347
METRIC RANK
40.9%
MARRIED-COUPLE HOUSEHOLDS
0.0/ 100
METRIC RATING
314th/ 347
METRIC RANK
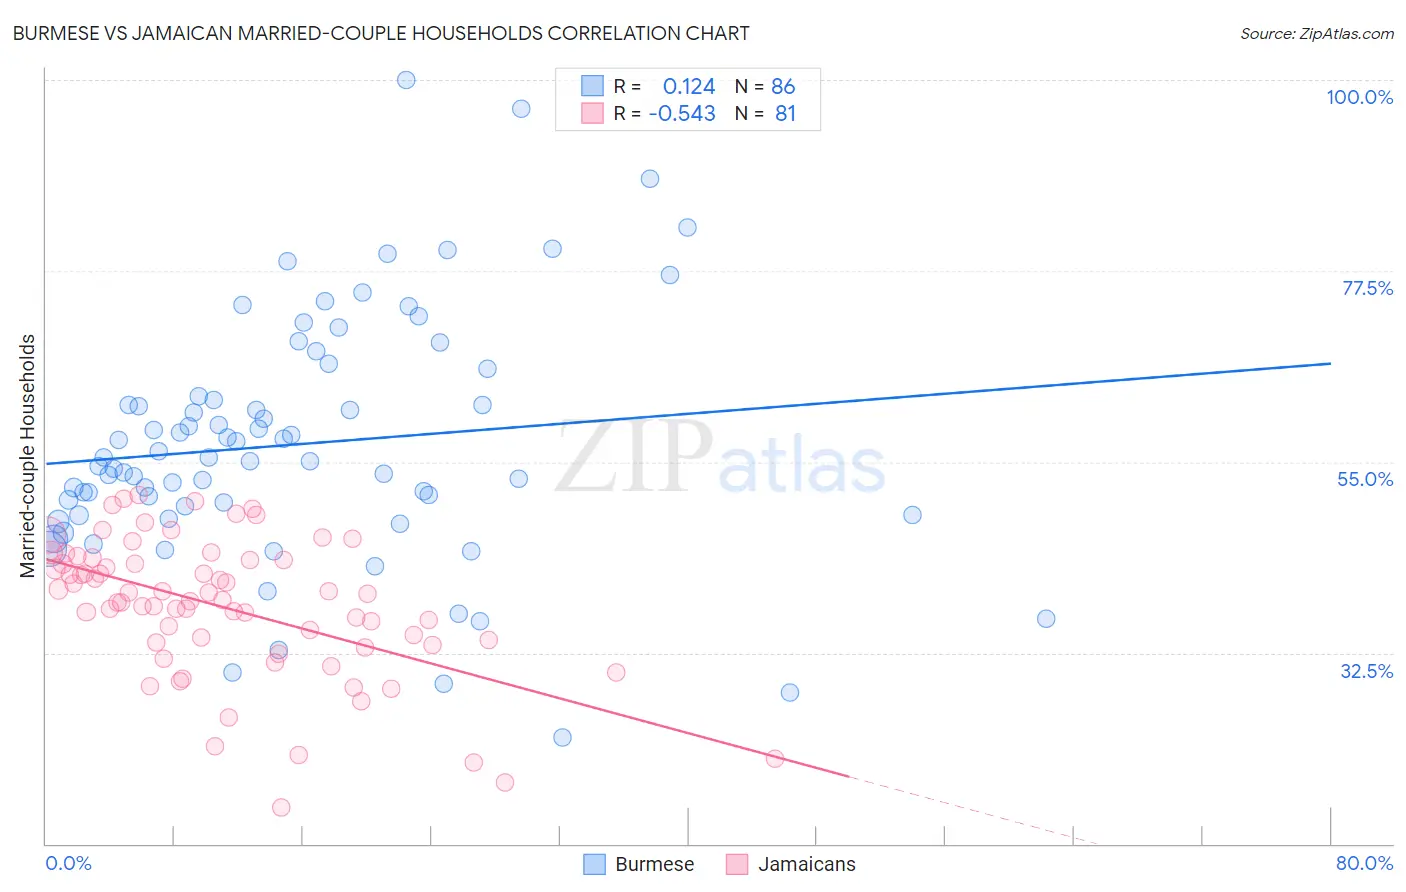
Burmese vs Jamaican Married-couple Households Correlation Chart
The statistical analysis conducted on geographies consisting of 464,866,079 people shows a poor positive correlation between the proportion of Burmese and percentage of married-couple family households in the United States with a correlation coefficient (R) of 0.124 and weighted average of 49.8%. Similarly, the statistical analysis conducted on geographies consisting of 367,621,560 people shows a substantial negative correlation between the proportion of Jamaicans and percentage of married-couple family households in the United States with a correlation coefficient (R) of -0.543 and weighted average of 40.9%, a difference of 21.8%.
Married-couple Households Correlation Summary
| Measurement | Burmese | Jamaican |
| Minimum | 22.5% | 14.3% |
| Maximum | 100.0% | 51.0% |
| Range | 77.5% | 36.7% |
| Mean | 57.1% | 37.9% |
| Median | 55.3% | 38.7% |
| Interquartile 25% (IQ1) | 48.7% | 33.6% |
| Interquartile 75% (IQ3) | 62.8% | 43.5% |
| Interquartile Range (IQR) | 14.0% | 9.9% |
| Standard Deviation (Sample) | 14.5% | 8.1% |
| Standard Deviation (Population) | 14.4% | 8.1% |
Similar Demographics by Married-couple Households
Demographics Similar to Burmese by Married-couple Households
In terms of married-couple households, the demographic groups most similar to Burmese are Immigrants from Korea (49.9%, a difference of 0.13%), Korean (49.7%, a difference of 0.14%), Swedish (49.7%, a difference of 0.18%), Swiss (49.9%, a difference of 0.30%), and Immigrants from Hong Kong (49.6%, a difference of 0.33%).
| Demographics | Rating | Rank | Married-couple Households |
| Filipinos | 100.0 /100 | #7 | Exceptional 51.0% |
| Immigrants | South Central Asia | 100.0 /100 | #8 | Exceptional 50.6% |
| Pennsylvania Germans | 100.0 /100 | #9 | Exceptional 50.4% |
| Chinese | 100.0 /100 | #10 | Exceptional 50.4% |
| Immigrants | Pakistan | 100.0 /100 | #11 | Exceptional 50.1% |
| Swiss | 100.0 /100 | #12 | Exceptional 49.9% |
| Immigrants | Korea | 100.0 /100 | #13 | Exceptional 49.9% |
| Burmese | 100.0 /100 | #14 | Exceptional 49.8% |
| Koreans | 99.9 /100 | #15 | Exceptional 49.7% |
| Swedes | 99.9 /100 | #16 | Exceptional 49.7% |
| Immigrants | Hong Kong | 99.9 /100 | #17 | Exceptional 49.6% |
| English | 99.9 /100 | #18 | Exceptional 49.6% |
| Europeans | 99.9 /100 | #19 | Exceptional 49.6% |
| Scandinavians | 99.9 /100 | #20 | Exceptional 49.6% |
| Norwegians | 99.9 /100 | #21 | Exceptional 49.5% |
Demographics Similar to Jamaicans by Married-couple Households
In terms of married-couple households, the demographic groups most similar to Jamaicans are Immigrants from Haiti (40.9%, a difference of 0.080%), Trinidadian and Tobagonian (40.9%, a difference of 0.080%), African (40.9%, a difference of 0.14%), Colville (41.0%, a difference of 0.22%), and Immigrants from Caribbean (40.8%, a difference of 0.26%).
| Demographics | Rating | Rank | Married-couple Households |
| Immigrants | Western Africa | 0.0 /100 | #307 | Tragic 41.4% |
| Crow | 0.0 /100 | #308 | Tragic 41.4% |
| Immigrants | Trinidad and Tobago | 0.0 /100 | #309 | Tragic 41.2% |
| Haitians | 0.0 /100 | #310 | Tragic 41.2% |
| Colville | 0.0 /100 | #311 | Tragic 41.0% |
| Africans | 0.0 /100 | #312 | Tragic 40.9% |
| Immigrants | Haiti | 0.0 /100 | #313 | Tragic 40.9% |
| Jamaicans | 0.0 /100 | #314 | Tragic 40.9% |
| Trinidadians and Tobagonians | 0.0 /100 | #315 | Tragic 40.9% |
| Immigrants | Caribbean | 0.0 /100 | #316 | Tragic 40.8% |
| Immigrants | Jamaica | 0.0 /100 | #317 | Tragic 40.7% |
| Liberians | 0.0 /100 | #318 | Tragic 40.7% |
| Bahamians | 0.0 /100 | #319 | Tragic 40.5% |
| West Indians | 0.0 /100 | #320 | Tragic 40.3% |
| Immigrants | Liberia | 0.0 /100 | #321 | Tragic 40.3% |