Immigrants from Sri Lanka vs Immigrants from Ghana College, 1 year or more
COMPARE
Immigrants from Sri Lanka
Immigrants from Ghana
College, 1 year or more
College, 1 year or more Comparison
Immigrants from Sri Lanka
Immigrants from Ghana
65.4%
COLLEGE, 1 YEAR OR MORE
99.9/ 100
METRIC RATING
33rd/ 347
METRIC RANK
57.4%
COLLEGE, 1 YEAR OR MORE
7.7/ 100
METRIC RATING
221st/ 347
METRIC RANK
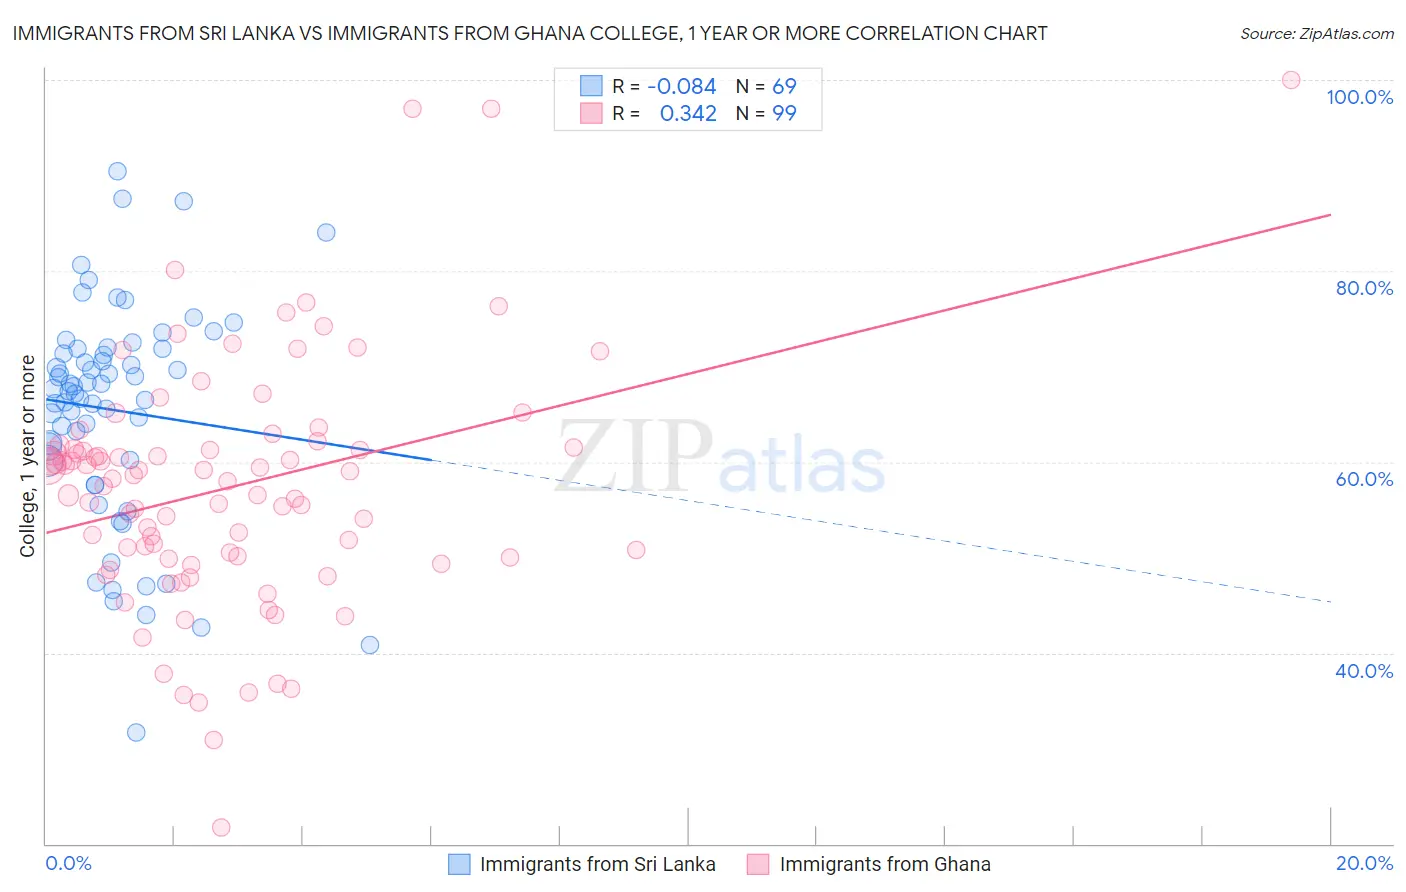
Immigrants from Sri Lanka vs Immigrants from Ghana College, 1 year or more Correlation Chart
The statistical analysis conducted on geographies consisting of 149,700,552 people shows a slight negative correlation between the proportion of Immigrants from Sri Lanka and percentage of population with at least college, 1 year or more education in the United States with a correlation coefficient (R) of -0.084 and weighted average of 65.4%. Similarly, the statistical analysis conducted on geographies consisting of 199,951,982 people shows a mild positive correlation between the proportion of Immigrants from Ghana and percentage of population with at least college, 1 year or more education in the United States with a correlation coefficient (R) of 0.342 and weighted average of 57.4%, a difference of 13.8%.
College, 1 year or more Correlation Summary
| Measurement | Immigrants from Sri Lanka | Immigrants from Ghana |
| Minimum | 31.7% | 21.7% |
| Maximum | 90.4% | 100.0% |
| Range | 58.7% | 78.3% |
| Mean | 65.4% | 57.3% |
| Median | 67.7% | 58.2% |
| Interquartile 25% (IQ1) | 60.1% | 50.0% |
| Interquartile 75% (IQ3) | 71.9% | 61.5% |
| Interquartile Range (IQR) | 11.8% | 11.5% |
| Standard Deviation (Sample) | 11.5% | 12.8% |
| Standard Deviation (Population) | 11.4% | 12.7% |
Similar Demographics by College, 1 year or more
Demographics Similar to Immigrants from Sri Lanka by College, 1 year or more
In terms of college, 1 year or more, the demographic groups most similar to Immigrants from Sri Lanka are Israeli (65.3%, a difference of 0.12%), Bulgarian (65.5%, a difference of 0.15%), Turkish (65.5%, a difference of 0.20%), Immigrants from Denmark (65.6%, a difference of 0.28%), and Immigrants from Turkey (65.2%, a difference of 0.32%).
| Demographics | Rating | Rank | College, 1 year or more |
| Latvians | 100.0 /100 | #26 | Exceptional 66.1% |
| Immigrants | Ireland | 100.0 /100 | #27 | Exceptional 65.9% |
| Immigrants | France | 100.0 /100 | #28 | Exceptional 65.8% |
| Immigrants | Northern Europe | 100.0 /100 | #29 | Exceptional 65.6% |
| Immigrants | Denmark | 100.0 /100 | #30 | Exceptional 65.6% |
| Turks | 100.0 /100 | #31 | Exceptional 65.5% |
| Bulgarians | 100.0 /100 | #32 | Exceptional 65.5% |
| Immigrants | Sri Lanka | 99.9 /100 | #33 | Exceptional 65.4% |
| Israelis | 99.9 /100 | #34 | Exceptional 65.3% |
| Immigrants | Turkey | 99.9 /100 | #35 | Exceptional 65.2% |
| Immigrants | South Africa | 99.9 /100 | #36 | Exceptional 65.1% |
| Russians | 99.9 /100 | #37 | Exceptional 65.1% |
| Immigrants | Saudi Arabia | 99.9 /100 | #38 | Exceptional 65.0% |
| Estonians | 99.9 /100 | #39 | Exceptional 65.0% |
| Immigrants | Kuwait | 99.9 /100 | #40 | Exceptional 65.0% |
Demographics Similar to Immigrants from Ghana by College, 1 year or more
In terms of college, 1 year or more, the demographic groups most similar to Immigrants from Ghana are Immigrants from Costa Rica (57.5%, a difference of 0.070%), White/Caucasian (57.6%, a difference of 0.19%), Immigrants from Panama (57.6%, a difference of 0.25%), Native Hawaiian (57.6%, a difference of 0.25%), and Subsaharan African (57.3%, a difference of 0.34%).
| Demographics | Rating | Rank | College, 1 year or more |
| Immigrants | Colombia | 11.6 /100 | #214 | Poor 57.8% |
| Tongans | 11.6 /100 | #215 | Poor 57.8% |
| Immigrants | Peru | 10.6 /100 | #216 | Poor 57.7% |
| Immigrants | Panama | 9.1 /100 | #217 | Tragic 57.6% |
| Native Hawaiians | 9.0 /100 | #218 | Tragic 57.6% |
| Whites/Caucasians | 8.7 /100 | #219 | Tragic 57.6% |
| Immigrants | Costa Rica | 8.0 /100 | #220 | Tragic 57.5% |
| Immigrants | Ghana | 7.7 /100 | #221 | Tragic 57.4% |
| Sub-Saharan Africans | 6.1 /100 | #222 | Tragic 57.3% |
| Portuguese | 5.4 /100 | #223 | Tragic 57.2% |
| Hmong | 5.4 /100 | #224 | Tragic 57.2% |
| Vietnamese | 4.7 /100 | #225 | Tragic 57.0% |
| Immigrants | Western Africa | 4.6 /100 | #226 | Tragic 57.0% |
| Immigrants | Immigrants | 4.4 /100 | #227 | Tragic 57.0% |
| Immigrants | Fiji | 4.0 /100 | #228 | Tragic 56.9% |