Immigrants from Sri Lanka vs Celtic Currently Married
COMPARE
Immigrants from Sri Lanka
Celtic
Currently Married
Currently Married Comparison
Immigrants from Sri Lanka
Celtics
48.1%
CURRENTLY MARRIED
96.9/ 100
METRIC RATING
81st/ 347
METRIC RANK
47.8%
CURRENTLY MARRIED
94.2/ 100
METRIC RATING
100th/ 347
METRIC RANK
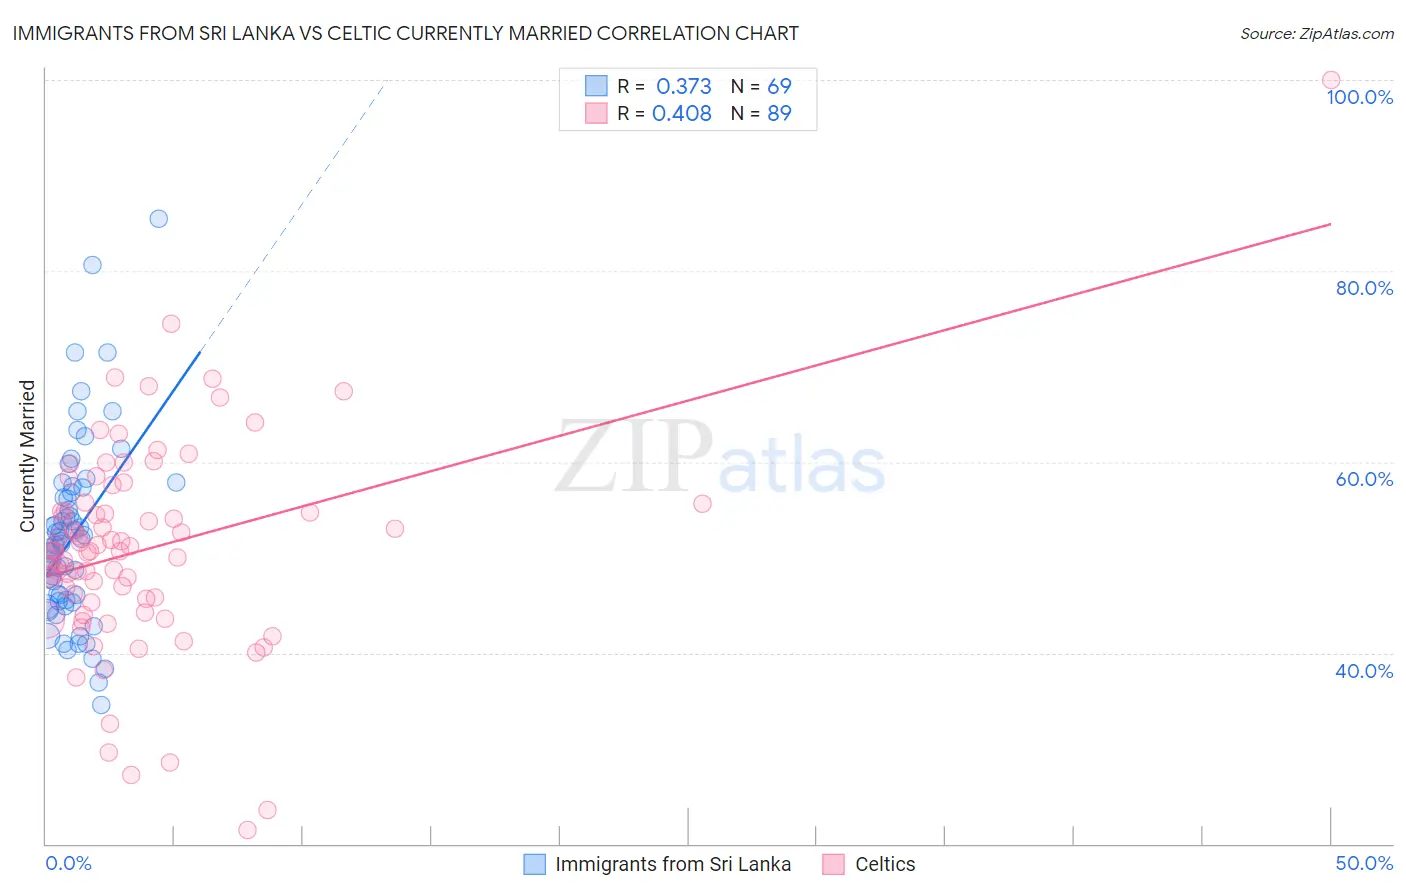
Immigrants from Sri Lanka vs Celtic Currently Married Correlation Chart
The statistical analysis conducted on geographies consisting of 149,691,933 people shows a mild positive correlation between the proportion of Immigrants from Sri Lanka and percentage of population currently married in the United States with a correlation coefficient (R) of 0.373 and weighted average of 48.1%. Similarly, the statistical analysis conducted on geographies consisting of 168,877,326 people shows a moderate positive correlation between the proportion of Celtics and percentage of population currently married in the United States with a correlation coefficient (R) of 0.408 and weighted average of 47.8%, a difference of 0.59%.
Currently Married Correlation Summary
| Measurement | Immigrants from Sri Lanka | Celtic |
| Minimum | 34.5% | 21.4% |
| Maximum | 85.5% | 100.0% |
| Range | 51.0% | 78.6% |
| Mean | 52.2% | 50.8% |
| Median | 51.7% | 50.7% |
| Interquartile 25% (IQ1) | 45.5% | 45.4% |
| Interquartile 75% (IQ3) | 57.1% | 55.2% |
| Interquartile Range (IQR) | 11.6% | 9.8% |
| Standard Deviation (Sample) | 9.6% | 11.1% |
| Standard Deviation (Population) | 9.5% | 11.0% |
Demographics Similar to Immigrants from Sri Lanka and Celtics by Currently Married
In terms of currently married, the demographic groups most similar to Immigrants from Sri Lanka are Immigrants from Europe (48.1%, a difference of 0.0%), Immigrants from Poland (48.1%, a difference of 0.010%), Bolivian (48.1%, a difference of 0.010%), Immigrants from Israel (48.1%, a difference of 0.010%), and French Canadian (48.0%, a difference of 0.15%). Similarly, the demographic groups most similar to Celtics are Immigrants from Sweden (47.8%, a difference of 0.020%), Immigrants from China (47.9%, a difference of 0.10%), Immigrants from Ukraine (47.9%, a difference of 0.11%), Immigrants from Bulgaria (47.9%, a difference of 0.12%), and Egyptian (47.9%, a difference of 0.12%).
| Demographics | Rating | Rank | Currently Married |
| Immigrants | Poland | 96.9 /100 | #80 | Exceptional 48.1% |
| Immigrants | Sri Lanka | 96.9 /100 | #81 | Exceptional 48.1% |
| Immigrants | Europe | 96.9 /100 | #82 | Exceptional 48.1% |
| Bolivians | 96.9 /100 | #83 | Exceptional 48.1% |
| Immigrants | Israel | 96.9 /100 | #84 | Exceptional 48.1% |
| French Canadians | 96.3 /100 | #85 | Exceptional 48.0% |
| Immigrants | Japan | 96.2 /100 | #86 | Exceptional 48.0% |
| Jordanians | 96.2 /100 | #87 | Exceptional 48.0% |
| Immigrants | Eastern Europe | 96.1 /100 | #88 | Exceptional 48.0% |
| Indians (Asian) | 95.8 /100 | #89 | Exceptional 48.0% |
| Americans | 95.7 /100 | #90 | Exceptional 48.0% |
| Immigrants | Bolivia | 95.6 /100 | #91 | Exceptional 47.9% |
| Koreans | 95.4 /100 | #92 | Exceptional 47.9% |
| Lebanese | 95.1 /100 | #93 | Exceptional 47.9% |
| Native Hawaiians | 95.0 /100 | #94 | Exceptional 47.9% |
| Immigrants | Bulgaria | 94.8 /100 | #95 | Exceptional 47.9% |
| Egyptians | 94.8 /100 | #96 | Exceptional 47.9% |
| Immigrants | Ukraine | 94.8 /100 | #97 | Exceptional 47.9% |
| Immigrants | China | 94.7 /100 | #98 | Exceptional 47.9% |
| Immigrants | Sweden | 94.3 /100 | #99 | Exceptional 47.8% |
| Celtics | 94.2 /100 | #100 | Exceptional 47.8% |