Immigrants from Sri Lanka vs Immigrants from Sierra Leone Currently Married
COMPARE
Immigrants from Sri Lanka
Immigrants from Sierra Leone
Currently Married
Currently Married Comparison
Immigrants from Sri Lanka
Immigrants from Sierra Leone
48.1%
CURRENTLY MARRIED
96.9/ 100
METRIC RATING
81st/ 347
METRIC RANK
43.8%
CURRENTLY MARRIED
0.1/ 100
METRIC RATING
259th/ 347
METRIC RANK
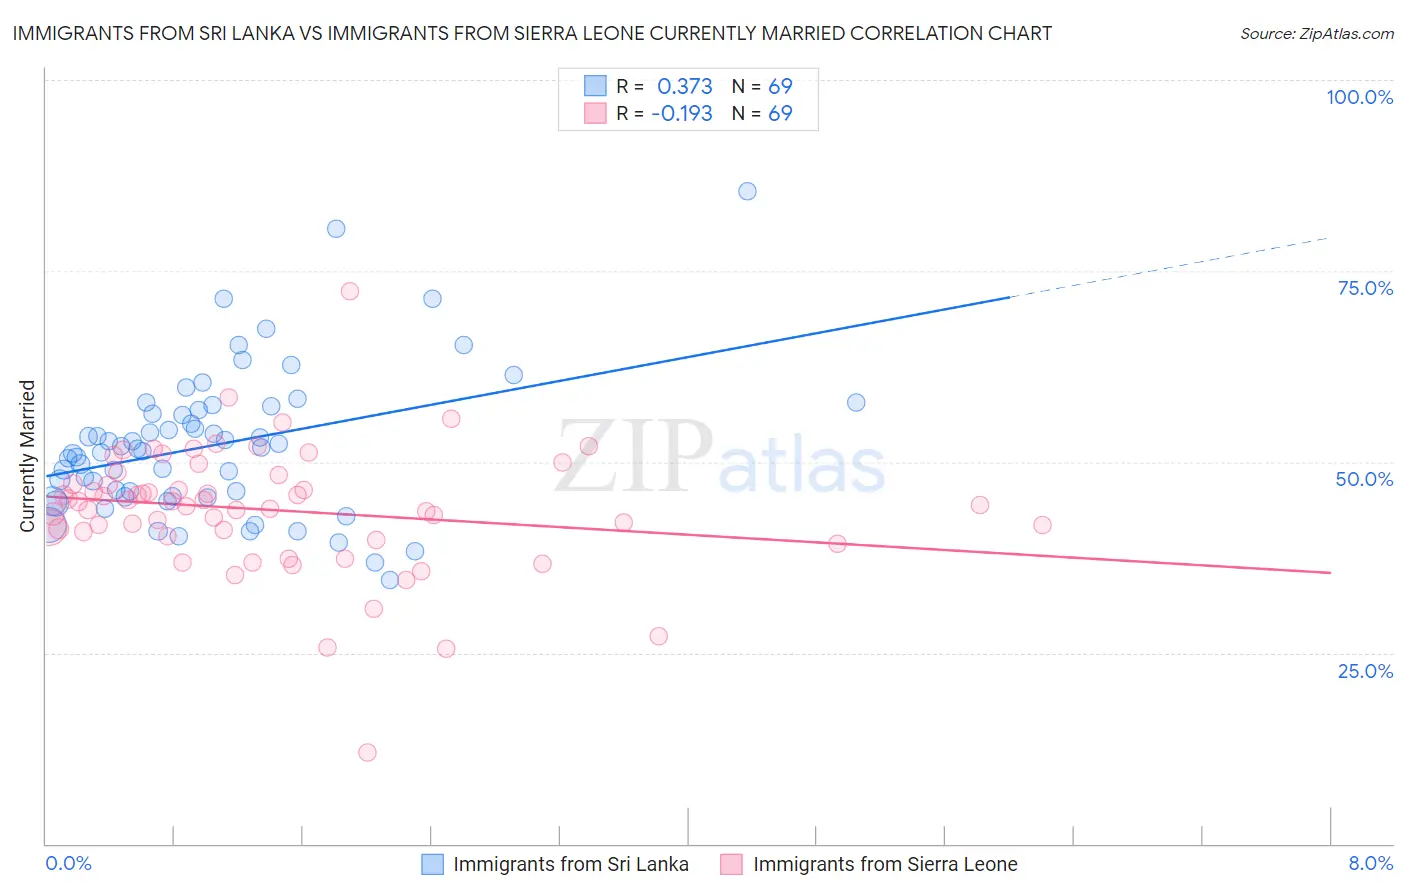
Immigrants from Sri Lanka vs Immigrants from Sierra Leone Currently Married Correlation Chart
The statistical analysis conducted on geographies consisting of 149,691,933 people shows a mild positive correlation between the proportion of Immigrants from Sri Lanka and percentage of population currently married in the United States with a correlation coefficient (R) of 0.373 and weighted average of 48.1%. Similarly, the statistical analysis conducted on geographies consisting of 101,652,138 people shows a poor negative correlation between the proportion of Immigrants from Sierra Leone and percentage of population currently married in the United States with a correlation coefficient (R) of -0.193 and weighted average of 43.8%, a difference of 9.8%.
Currently Married Correlation Summary
| Measurement | Immigrants from Sri Lanka | Immigrants from Sierra Leone |
| Minimum | 34.5% | 12.0% |
| Maximum | 85.5% | 72.3% |
| Range | 51.0% | 60.3% |
| Mean | 52.2% | 43.7% |
| Median | 51.7% | 44.4% |
| Interquartile 25% (IQ1) | 45.5% | 40.5% |
| Interquartile 75% (IQ3) | 57.1% | 47.7% |
| Interquartile Range (IQR) | 11.6% | 7.1% |
| Standard Deviation (Sample) | 9.6% | 8.4% |
| Standard Deviation (Population) | 9.5% | 8.3% |
Similar Demographics by Currently Married
Demographics Similar to Immigrants from Sri Lanka by Currently Married
In terms of currently married, the demographic groups most similar to Immigrants from Sri Lanka are Immigrants from Europe (48.1%, a difference of 0.0%), Immigrants from Poland (48.1%, a difference of 0.010%), Bolivian (48.1%, a difference of 0.010%), Immigrants from Israel (48.1%, a difference of 0.010%), and Immigrants from South Africa (48.1%, a difference of 0.040%).
| Demographics | Rating | Rank | Currently Married |
| Estonians | 97.4 /100 | #74 | Exceptional 48.2% |
| Immigrants | Belarus | 97.2 /100 | #75 | Exceptional 48.1% |
| Basques | 97.2 /100 | #76 | Exceptional 48.1% |
| Slovenes | 97.1 /100 | #77 | Exceptional 48.1% |
| Immigrants | Belgium | 97.1 /100 | #78 | Exceptional 48.1% |
| Immigrants | South Africa | 97.0 /100 | #79 | Exceptional 48.1% |
| Immigrants | Poland | 96.9 /100 | #80 | Exceptional 48.1% |
| Immigrants | Sri Lanka | 96.9 /100 | #81 | Exceptional 48.1% |
| Immigrants | Europe | 96.9 /100 | #82 | Exceptional 48.1% |
| Bolivians | 96.9 /100 | #83 | Exceptional 48.1% |
| Immigrants | Israel | 96.9 /100 | #84 | Exceptional 48.1% |
| French Canadians | 96.3 /100 | #85 | Exceptional 48.0% |
| Immigrants | Japan | 96.2 /100 | #86 | Exceptional 48.0% |
| Jordanians | 96.2 /100 | #87 | Exceptional 48.0% |
| Immigrants | Eastern Europe | 96.1 /100 | #88 | Exceptional 48.0% |
Demographics Similar to Immigrants from Sierra Leone by Currently Married
In terms of currently married, the demographic groups most similar to Immigrants from Sierra Leone are Immigrants from Latin America (43.8%, a difference of 0.060%), Immigrants from Nicaragua (43.7%, a difference of 0.11%), Ute (43.9%, a difference of 0.21%), Immigrants from Africa (43.9%, a difference of 0.22%), and Bangladeshi (43.7%, a difference of 0.25%).
| Demographics | Rating | Rank | Currently Married |
| Hispanics or Latinos | 0.3 /100 | #252 | Tragic 44.1% |
| Immigrants | Central America | 0.3 /100 | #253 | Tragic 44.1% |
| Vietnamese | 0.2 /100 | #254 | Tragic 44.0% |
| Yakama | 0.2 /100 | #255 | Tragic 44.0% |
| Shoshone | 0.2 /100 | #256 | Tragic 44.0% |
| Immigrants | Africa | 0.2 /100 | #257 | Tragic 43.9% |
| Ute | 0.2 /100 | #258 | Tragic 43.9% |
| Immigrants | Sierra Leone | 0.1 /100 | #259 | Tragic 43.8% |
| Immigrants | Latin America | 0.1 /100 | #260 | Tragic 43.8% |
| Immigrants | Nicaragua | 0.1 /100 | #261 | Tragic 43.7% |
| Bangladeshis | 0.1 /100 | #262 | Tragic 43.7% |
| Immigrants | Cuba | 0.1 /100 | #263 | Tragic 43.7% |
| Sudanese | 0.1 /100 | #264 | Tragic 43.7% |
| Immigrants | Bangladesh | 0.1 /100 | #265 | Tragic 43.6% |
| Ecuadorians | 0.1 /100 | #266 | Tragic 43.6% |