Immigrants from Sri Lanka vs Romanian Currently Married
COMPARE
Immigrants from Sri Lanka
Romanian
Currently Married
Currently Married Comparison
Immigrants from Sri Lanka
Romanians
48.1%
CURRENTLY MARRIED
96.9/ 100
METRIC RATING
81st/ 347
METRIC RANK
48.4%
CURRENTLY MARRIED
98.5/ 100
METRIC RATING
61st/ 347
METRIC RANK
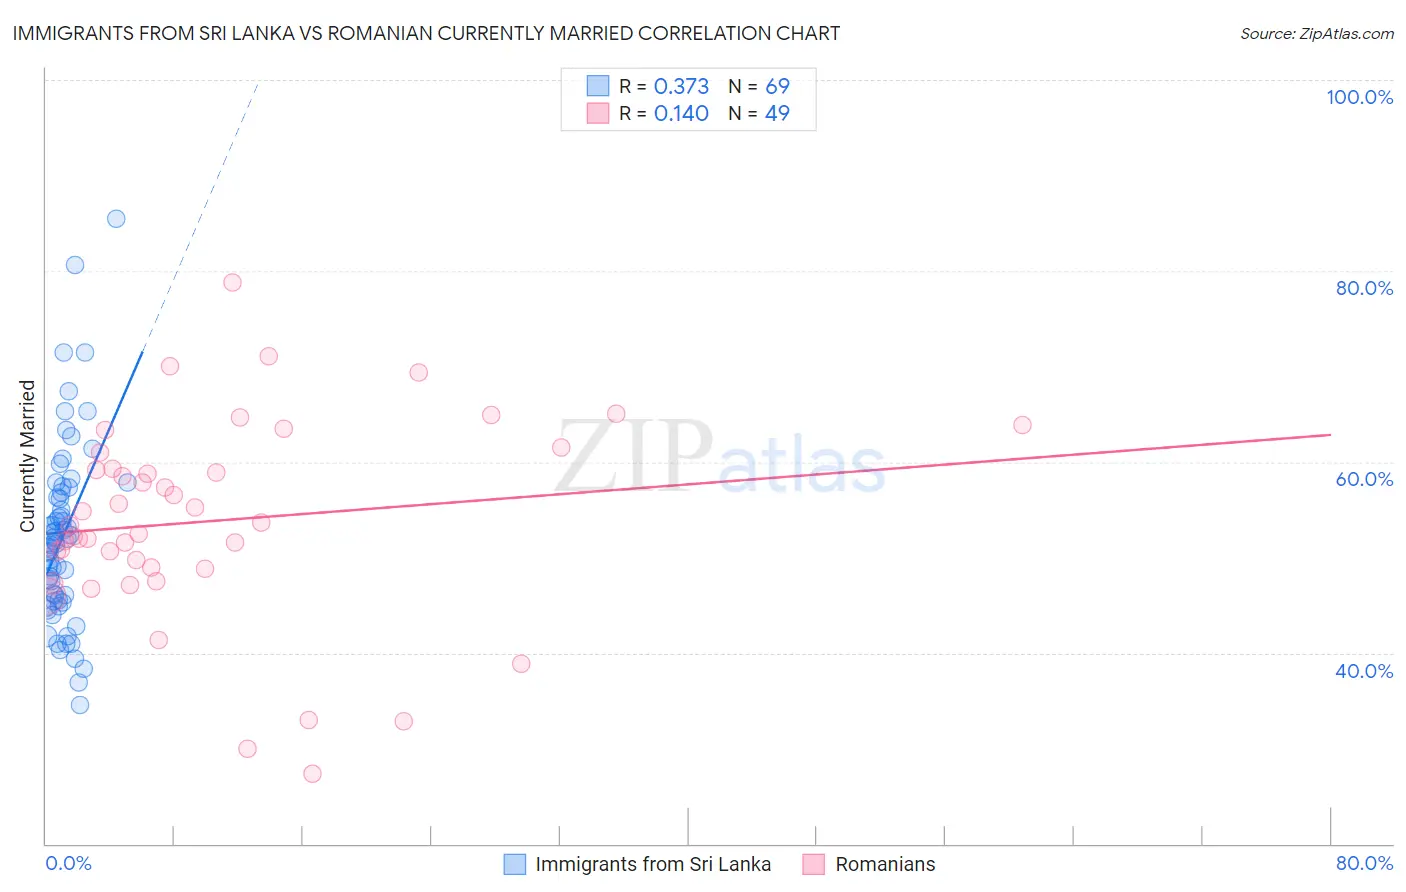
Immigrants from Sri Lanka vs Romanian Currently Married Correlation Chart
The statistical analysis conducted on geographies consisting of 149,691,933 people shows a mild positive correlation between the proportion of Immigrants from Sri Lanka and percentage of population currently married in the United States with a correlation coefficient (R) of 0.373 and weighted average of 48.1%. Similarly, the statistical analysis conducted on geographies consisting of 377,883,259 people shows a poor positive correlation between the proportion of Romanians and percentage of population currently married in the United States with a correlation coefficient (R) of 0.140 and weighted average of 48.4%, a difference of 0.65%.
Currently Married Correlation Summary
| Measurement | Immigrants from Sri Lanka | Romanian |
| Minimum | 34.5% | 27.3% |
| Maximum | 85.5% | 78.8% |
| Range | 51.0% | 51.5% |
| Mean | 52.2% | 53.8% |
| Median | 51.7% | 53.4% |
| Interquartile 25% (IQ1) | 45.5% | 48.9% |
| Interquartile 75% (IQ3) | 57.1% | 60.1% |
| Interquartile Range (IQR) | 11.6% | 11.2% |
| Standard Deviation (Sample) | 9.6% | 10.5% |
| Standard Deviation (Population) | 9.5% | 10.4% |
Demographics Similar to Immigrants from Sri Lanka and Romanians by Currently Married
In terms of currently married, the demographic groups most similar to Immigrants from Sri Lanka are Immigrants from Poland (48.1%, a difference of 0.010%), Immigrants from South Africa (48.1%, a difference of 0.040%), Immigrants from Belgium (48.1%, a difference of 0.050%), Slovene (48.1%, a difference of 0.060%), and Basque (48.1%, a difference of 0.080%). Similarly, the demographic groups most similar to Romanians are Asian (48.4%, a difference of 0.0%), Slavic (48.4%, a difference of 0.11%), Immigrants from Czechoslovakia (48.4%, a difference of 0.11%), Ukrainian (48.4%, a difference of 0.12%), and Tongan (48.3%, a difference of 0.14%).
| Demographics | Rating | Rank | Currently Married |
| Romanians | 98.5 /100 | #61 | Exceptional 48.4% |
| Asians | 98.5 /100 | #62 | Exceptional 48.4% |
| Slavs | 98.3 /100 | #63 | Exceptional 48.4% |
| Immigrants | Czechoslovakia | 98.3 /100 | #64 | Exceptional 48.4% |
| Ukrainians | 98.3 /100 | #65 | Exceptional 48.4% |
| Tongans | 98.2 /100 | #66 | Exceptional 48.3% |
| Slovaks | 98.2 /100 | #67 | Exceptional 48.3% |
| Immigrants | England | 98.2 /100 | #68 | Exceptional 48.3% |
| Canadians | 98.1 /100 | #69 | Exceptional 48.3% |
| Immigrants | Asia | 97.9 /100 | #70 | Exceptional 48.3% |
| Macedonians | 97.9 /100 | #71 | Exceptional 48.3% |
| Immigrants | Lebanon | 97.6 /100 | #72 | Exceptional 48.2% |
| Immigrants | Eastern Asia | 97.5 /100 | #73 | Exceptional 48.2% |
| Estonians | 97.4 /100 | #74 | Exceptional 48.2% |
| Immigrants | Belarus | 97.2 /100 | #75 | Exceptional 48.1% |
| Basques | 97.2 /100 | #76 | Exceptional 48.1% |
| Slovenes | 97.1 /100 | #77 | Exceptional 48.1% |
| Immigrants | Belgium | 97.1 /100 | #78 | Exceptional 48.1% |
| Immigrants | South Africa | 97.0 /100 | #79 | Exceptional 48.1% |
| Immigrants | Poland | 96.9 /100 | #80 | Exceptional 48.1% |
| Immigrants | Sri Lanka | 96.9 /100 | #81 | Exceptional 48.1% |