Immigrants from South Central Asia vs Scotch-Irish Male Disability
COMPARE
Immigrants from South Central Asia
Scotch-Irish
Male Disability
Male Disability Comparison
Immigrants from South Central Asia
Scotch-Irish
9.4%
MALE DISABILITY
100.0/ 100
METRIC RATING
6th/ 347
METRIC RANK
13.2%
MALE DISABILITY
0.0/ 100
METRIC RATING
303rd/ 347
METRIC RANK
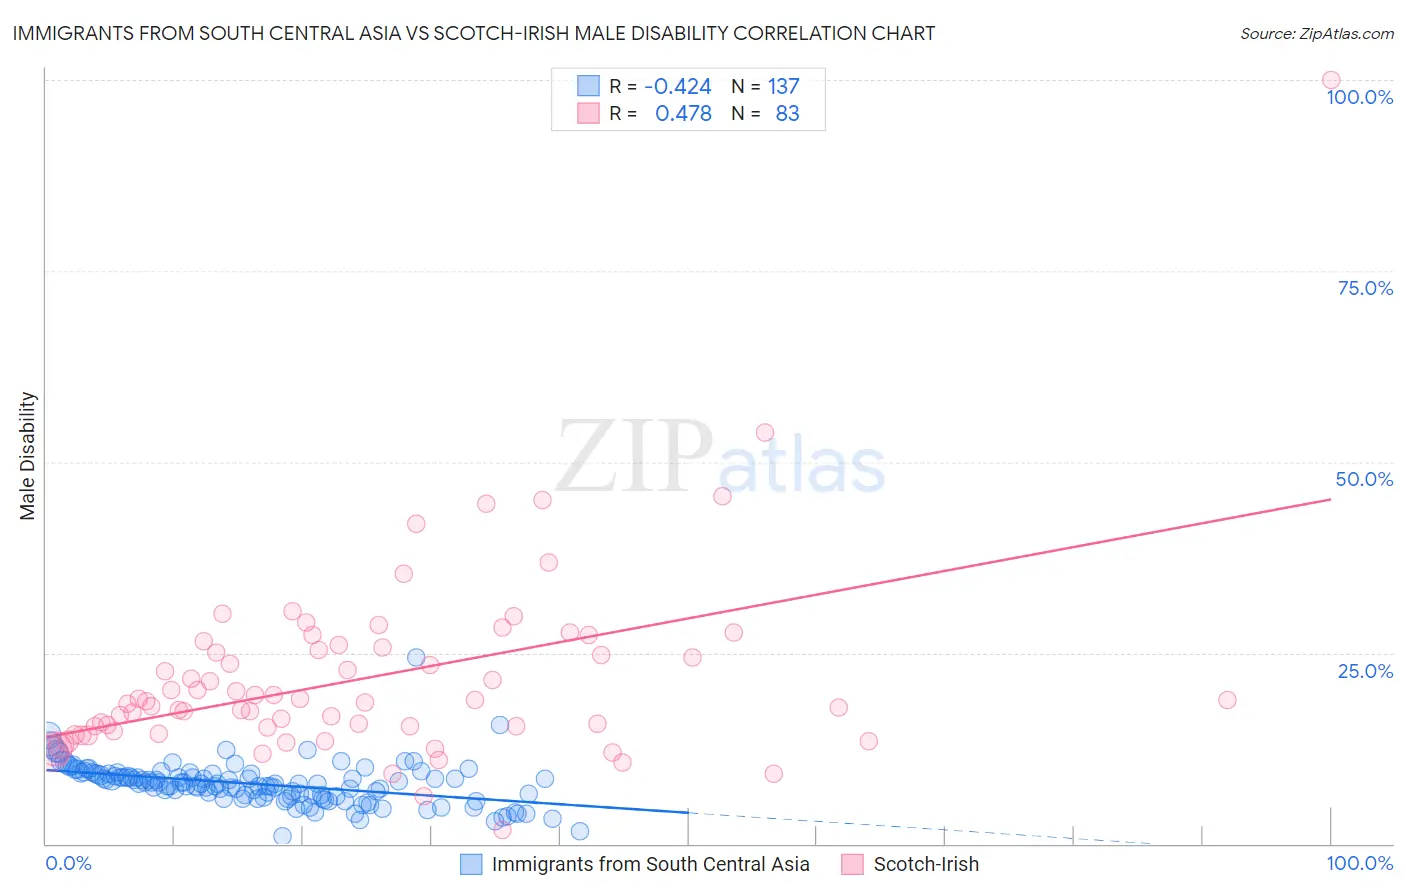
Immigrants from South Central Asia vs Scotch-Irish Male Disability Correlation Chart
The statistical analysis conducted on geographies consisting of 473,016,937 people shows a moderate negative correlation between the proportion of Immigrants from South Central Asia and percentage of males with a disability in the United States with a correlation coefficient (R) of -0.424 and weighted average of 9.4%. Similarly, the statistical analysis conducted on geographies consisting of 548,574,277 people shows a moderate positive correlation between the proportion of Scotch-Irish and percentage of males with a disability in the United States with a correlation coefficient (R) of 0.478 and weighted average of 13.2%, a difference of 39.9%.
Male Disability Correlation Summary
| Measurement | Immigrants from South Central Asia | Scotch-Irish |
| Minimum | 0.93% | 1.8% |
| Maximum | 24.4% | 100.0% |
| Range | 23.5% | 98.2% |
| Mean | 7.8% | 21.6% |
| Median | 7.9% | 18.6% |
| Interquartile 25% (IQ1) | 6.2% | 14.8% |
| Interquartile 75% (IQ3) | 9.1% | 25.6% |
| Interquartile Range (IQR) | 2.9% | 10.9% |
| Standard Deviation (Sample) | 2.8% | 12.6% |
| Standard Deviation (Population) | 2.8% | 12.6% |
Similar Demographics by Male Disability
Demographics Similar to Immigrants from South Central Asia by Male Disability
In terms of male disability, the demographic groups most similar to Immigrants from South Central Asia are Immigrants from Hong Kong (9.4%, a difference of 0.060%), Immigrants from Bolivia (9.5%, a difference of 0.33%), Immigrants from China (9.5%, a difference of 0.93%), Immigrants from Singapore (9.5%, a difference of 1.0%), and Immigrants from Israel (9.6%, a difference of 1.4%).
| Demographics | Rating | Rank | Male Disability |
| Immigrants | India | 100.0 /100 | #1 | Exceptional 9.0% |
| Immigrants | Taiwan | 100.0 /100 | #2 | Exceptional 9.1% |
| Filipinos | 100.0 /100 | #3 | Exceptional 9.1% |
| Thais | 100.0 /100 | #4 | Exceptional 9.2% |
| Immigrants | Hong Kong | 100.0 /100 | #5 | Exceptional 9.4% |
| Immigrants | South Central Asia | 100.0 /100 | #6 | Exceptional 9.4% |
| Immigrants | Bolivia | 100.0 /100 | #7 | Exceptional 9.5% |
| Immigrants | China | 100.0 /100 | #8 | Exceptional 9.5% |
| Immigrants | Singapore | 100.0 /100 | #9 | Exceptional 9.5% |
| Immigrants | Israel | 100.0 /100 | #10 | Exceptional 9.6% |
| Immigrants | Eastern Asia | 100.0 /100 | #11 | Exceptional 9.6% |
| Bolivians | 100.0 /100 | #12 | Exceptional 9.6% |
| Iranians | 100.0 /100 | #13 | Exceptional 9.7% |
| Immigrants | Iran | 100.0 /100 | #14 | Exceptional 9.7% |
| Indians (Asian) | 100.0 /100 | #15 | Exceptional 9.7% |
Demographics Similar to Scotch-Irish by Male Disability
In terms of male disability, the demographic groups most similar to Scotch-Irish are Black/African American (13.2%, a difference of 0.32%), Crow (13.1%, a difference of 0.54%), French Canadian (13.3%, a difference of 0.74%), Spanish American (13.3%, a difference of 0.94%), and French (13.0%, a difference of 1.1%).
| Demographics | Rating | Rank | Male Disability |
| Immigrants | Nonimmigrants | 0.0 /100 | #296 | Tragic 12.9% |
| Inupiat | 0.0 /100 | #297 | Tragic 13.0% |
| Pennsylvania Germans | 0.0 /100 | #298 | Tragic 13.0% |
| Celtics | 0.0 /100 | #299 | Tragic 13.0% |
| Cheyenne | 0.0 /100 | #300 | Tragic 13.0% |
| French | 0.0 /100 | #301 | Tragic 13.0% |
| Crow | 0.0 /100 | #302 | Tragic 13.1% |
| Scotch-Irish | 0.0 /100 | #303 | Tragic 13.2% |
| Blacks/African Americans | 0.0 /100 | #304 | Tragic 13.2% |
| French Canadians | 0.0 /100 | #305 | Tragic 13.3% |
| Spanish Americans | 0.0 /100 | #306 | Tragic 13.3% |
| Arapaho | 0.0 /100 | #307 | Tragic 13.3% |
| French American Indians | 0.0 /100 | #308 | Tragic 13.4% |
| Blackfeet | 0.0 /100 | #309 | Tragic 13.4% |
| Immigrants | Azores | 0.0 /100 | #310 | Tragic 13.4% |