Immigrants from South Central Asia vs Immigrants from Latin America Births to Unmarried Women
COMPARE
Immigrants from South Central Asia
Immigrants from Latin America
Births to Unmarried Women
Births to Unmarried Women Comparison
Immigrants from South Central Asia
Immigrants from Latin America
24.7%
BIRTHS TO UNMARRIED WOMEN
100.0/ 100
METRIC RATING
9th/ 347
METRIC RANK
37.1%
BIRTHS TO UNMARRIED WOMEN
0.1/ 100
METRIC RATING
278th/ 347
METRIC RANK
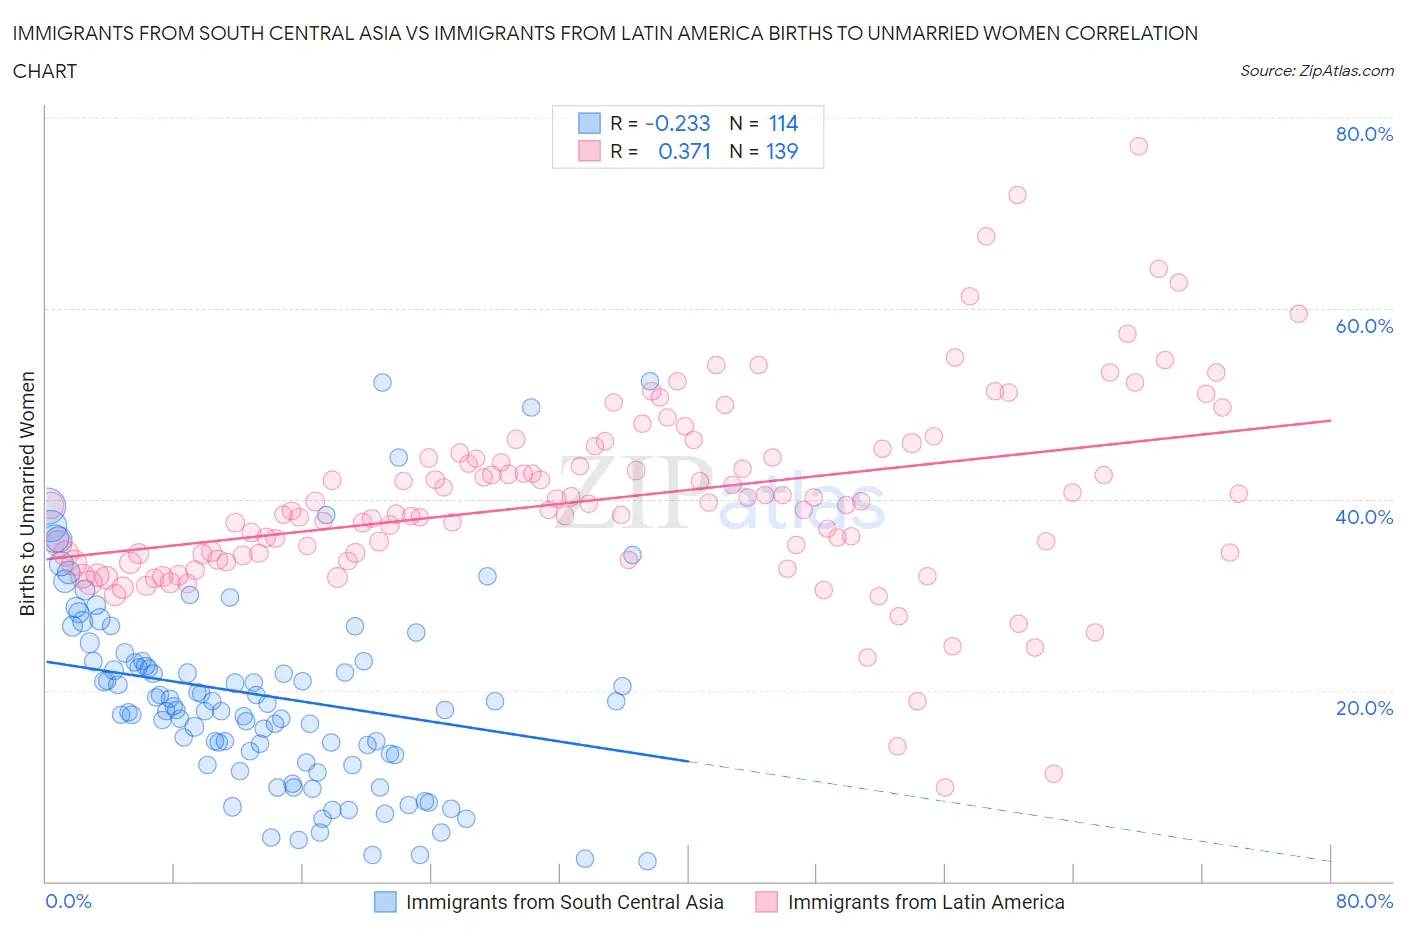
Immigrants from South Central Asia vs Immigrants from Latin America Births to Unmarried Women Correlation Chart
The statistical analysis conducted on geographies consisting of 435,679,472 people shows a weak negative correlation between the proportion of Immigrants from South Central Asia and percentage of births to unmarried women in the United States with a correlation coefficient (R) of -0.233 and weighted average of 24.7%. Similarly, the statistical analysis conducted on geographies consisting of 501,046,047 people shows a mild positive correlation between the proportion of Immigrants from Latin America and percentage of births to unmarried women in the United States with a correlation coefficient (R) of 0.371 and weighted average of 37.1%, a difference of 50.5%.
Births to Unmarried Women Correlation Summary
| Measurement | Immigrants from South Central Asia | Immigrants from Latin America |
| Minimum | 2.1% | 9.8% |
| Maximum | 52.4% | 77.0% |
| Range | 50.3% | 67.2% |
| Mean | 19.5% | 40.1% |
| Median | 18.4% | 39.4% |
| Interquartile 25% (IQ1) | 13.2% | 34.1% |
| Interquartile 75% (IQ3) | 23.1% | 44.9% |
| Interquartile Range (IQR) | 9.9% | 10.7% |
| Standard Deviation (Sample) | 10.2% | 10.3% |
| Standard Deviation (Population) | 10.2% | 10.3% |
Similar Demographics by Births to Unmarried Women
Demographics Similar to Immigrants from South Central Asia by Births to Unmarried Women
In terms of births to unmarried women, the demographic groups most similar to Immigrants from South Central Asia are Immigrants from China (24.7%, a difference of 0.010%), Immigrants from Eastern Asia (25.0%, a difference of 1.5%), Immigrants from Israel (25.1%, a difference of 1.9%), Indian (Asian) (25.3%, a difference of 2.4%), and Iranian (25.3%, a difference of 2.5%).
| Demographics | Rating | Rank | Births to Unmarried Women |
| Immigrants | India | 100.0 /100 | #2 | Exceptional 22.9% |
| Filipinos | 100.0 /100 | #3 | Exceptional 23.0% |
| Immigrants | Taiwan | 100.0 /100 | #4 | Exceptional 23.0% |
| Immigrants | Hong Kong | 100.0 /100 | #5 | Exceptional 23.6% |
| Immigrants | Iran | 100.0 /100 | #6 | Exceptional 24.0% |
| Thais | 100.0 /100 | #7 | Exceptional 24.0% |
| Immigrants | China | 100.0 /100 | #8 | Exceptional 24.7% |
| Immigrants | South Central Asia | 100.0 /100 | #9 | Exceptional 24.7% |
| Immigrants | Eastern Asia | 100.0 /100 | #10 | Exceptional 25.0% |
| Immigrants | Israel | 100.0 /100 | #11 | Exceptional 25.1% |
| Indians (Asian) | 100.0 /100 | #12 | Exceptional 25.3% |
| Iranians | 100.0 /100 | #13 | Exceptional 25.3% |
| Immigrants | Lebanon | 100.0 /100 | #14 | Exceptional 25.3% |
| Immigrants | Singapore | 100.0 /100 | #15 | Exceptional 25.6% |
| Immigrants | Belarus | 100.0 /100 | #16 | Exceptional 25.6% |
Demographics Similar to Immigrants from Latin America by Births to Unmarried Women
In terms of births to unmarried women, the demographic groups most similar to Immigrants from Latin America are Guatemalan (37.1%, a difference of 0.090%), Belizean (37.0%, a difference of 0.30%), West Indian (37.3%, a difference of 0.33%), Immigrants from St. Vincent and the Grenadines (37.3%, a difference of 0.45%), and Immigrants from Belize (37.3%, a difference of 0.47%).
| Demographics | Rating | Rank | Births to Unmarried Women |
| Immigrants | Barbados | 0.1 /100 | #271 | Tragic 36.8% |
| Choctaw | 0.1 /100 | #272 | Tragic 36.9% |
| Mexicans | 0.1 /100 | #273 | Tragic 36.9% |
| Cree | 0.1 /100 | #274 | Tragic 37.0% |
| Barbadians | 0.1 /100 | #275 | Tragic 37.0% |
| Belizeans | 0.1 /100 | #276 | Tragic 37.0% |
| Guatemalans | 0.1 /100 | #277 | Tragic 37.1% |
| Immigrants | Latin America | 0.1 /100 | #278 | Tragic 37.1% |
| West Indians | 0.1 /100 | #279 | Tragic 37.3% |
| Immigrants | St. Vincent and the Grenadines | 0.1 /100 | #280 | Tragic 37.3% |
| Immigrants | Belize | 0.1 /100 | #281 | Tragic 37.3% |
| Liberians | 0.0 /100 | #282 | Tragic 37.4% |
| Spanish American Indians | 0.0 /100 | #283 | Tragic 37.4% |
| Immigrants | Central America | 0.0 /100 | #284 | Tragic 37.4% |
| Immigrants | Mexico | 0.0 /100 | #285 | Tragic 37.5% |