Immigrants from Sierra Leone vs Immigrants from Romania Family Households
COMPARE
Immigrants from Sierra Leone
Immigrants from Romania
Family Households
Family Households Comparison
Immigrants from Sierra Leone
Immigrants from Romania
64.3%
FAMILY HOUSEHOLDS
52.5/ 100
METRIC RATING
173rd/ 347
METRIC RANK
64.6%
FAMILY HOUSEHOLDS
77.0/ 100
METRIC RATING
146th/ 347
METRIC RANK
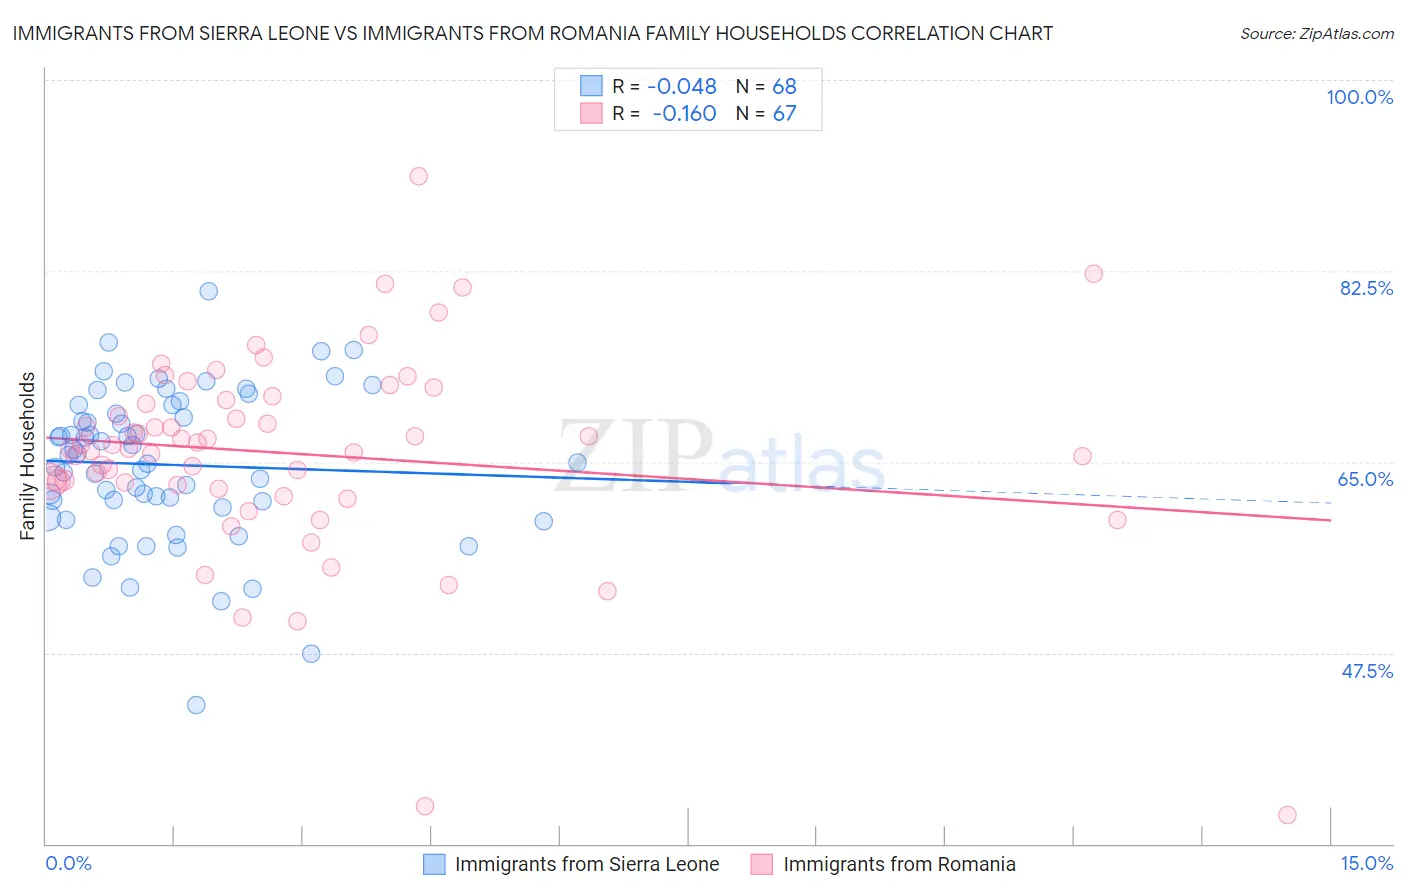
Immigrants from Sierra Leone vs Immigrants from Romania Family Households Correlation Chart
The statistical analysis conducted on geographies consisting of 101,647,201 people shows no correlation between the proportion of Immigrants from Sierra Leone and percentage of family households in the United States with a correlation coefficient (R) of -0.048 and weighted average of 64.3%. Similarly, the statistical analysis conducted on geographies consisting of 256,963,245 people shows a poor negative correlation between the proportion of Immigrants from Romania and percentage of family households in the United States with a correlation coefficient (R) of -0.160 and weighted average of 64.6%, a difference of 0.37%.
Family Households Correlation Summary
| Measurement | Immigrants from Sierra Leone | Immigrants from Romania |
| Minimum | 42.7% | 32.6% |
| Maximum | 80.6% | 91.2% |
| Range | 37.9% | 58.6% |
| Mean | 64.7% | 65.8% |
| Median | 65.3% | 66.2% |
| Interquartile 25% (IQ1) | 61.1% | 62.9% |
| Interquartile 75% (IQ3) | 69.8% | 70.7% |
| Interquartile Range (IQR) | 8.7% | 7.8% |
| Standard Deviation (Sample) | 7.0% | 9.4% |
| Standard Deviation (Population) | 6.9% | 9.3% |
Similar Demographics by Family Households
Demographics Similar to Immigrants from Sierra Leone by Family Households
In terms of family households, the demographic groups most similar to Immigrants from Sierra Leone are Dutch West Indian (64.3%, a difference of 0.020%), Ute (64.3%, a difference of 0.030%), Immigrants from Germany (64.3%, a difference of 0.030%), Iraqi (64.4%, a difference of 0.050%), and Armenian (64.4%, a difference of 0.050%).
| Demographics | Rating | Rank | Family Households |
| Scotch-Irish | 59.2 /100 | #166 | Average 64.4% |
| Irish | 57.9 /100 | #167 | Average 64.4% |
| Hondurans | 57.5 /100 | #168 | Average 64.4% |
| Iraqis | 56.0 /100 | #169 | Average 64.4% |
| Armenians | 55.9 /100 | #170 | Average 64.4% |
| Ute | 54.6 /100 | #171 | Average 64.3% |
| Dutch West Indians | 53.9 /100 | #172 | Average 64.3% |
| Immigrants | Sierra Leone | 52.5 /100 | #173 | Average 64.3% |
| Immigrants | Germany | 50.0 /100 | #174 | Average 64.3% |
| Bangladeshis | 44.3 /100 | #175 | Average 64.3% |
| Vietnamese | 43.6 /100 | #176 | Average 64.2% |
| Immigrants | Micronesia | 42.3 /100 | #177 | Average 64.2% |
| Jamaicans | 40.6 /100 | #178 | Average 64.2% |
| Immigrants | Ukraine | 38.2 /100 | #179 | Fair 64.2% |
| Immigrants | Honduras | 35.0 /100 | #180 | Fair 64.2% |
Demographics Similar to Immigrants from Romania by Family Households
In terms of family households, the demographic groups most similar to Immigrants from Romania are Immigrants from Chile (64.6%, a difference of 0.010%), Delaware (64.6%, a difference of 0.010%), Sioux (64.6%, a difference of 0.010%), Romanian (64.5%, a difference of 0.030%), and Syrian (64.5%, a difference of 0.030%).
| Demographics | Rating | Rank | Family Households |
| Immigrants | Jamaica | 85.3 /100 | #139 | Excellent 64.7% |
| Immigrants | North Macedonia | 84.9 /100 | #140 | Excellent 64.7% |
| Immigrants | Cameroon | 84.8 /100 | #141 | Excellent 64.7% |
| Pakistanis | 84.0 /100 | #142 | Excellent 64.7% |
| Czechoslovakians | 82.1 /100 | #143 | Excellent 64.6% |
| South American Indians | 81.9 /100 | #144 | Excellent 64.6% |
| Welsh | 80.1 /100 | #145 | Excellent 64.6% |
| Immigrants | Romania | 77.0 /100 | #146 | Good 64.6% |
| Immigrants | Chile | 76.5 /100 | #147 | Good 64.6% |
| Delaware | 76.3 /100 | #148 | Good 64.6% |
| Sioux | 76.3 /100 | #149 | Good 64.6% |
| Romanians | 75.3 /100 | #150 | Good 64.5% |
| Syrians | 75.2 /100 | #151 | Good 64.5% |
| Scottish | 70.9 /100 | #152 | Good 64.5% |
| Swedes | 69.8 /100 | #153 | Good 64.5% |