Immigrants from Portugal vs Immigrants from Nepal Married-couple Households
COMPARE
Immigrants from Portugal
Immigrants from Nepal
Married-couple Households
Married-couple Households Comparison
Immigrants from Portugal
Immigrants from Nepal
45.2%
MARRIED-COUPLE HOUSEHOLDS
5.6/ 100
METRIC RATING
216th/ 347
METRIC RANK
45.2%
MARRIED-COUPLE HOUSEHOLDS
5.6/ 100
METRIC RATING
215th/ 347
METRIC RANK
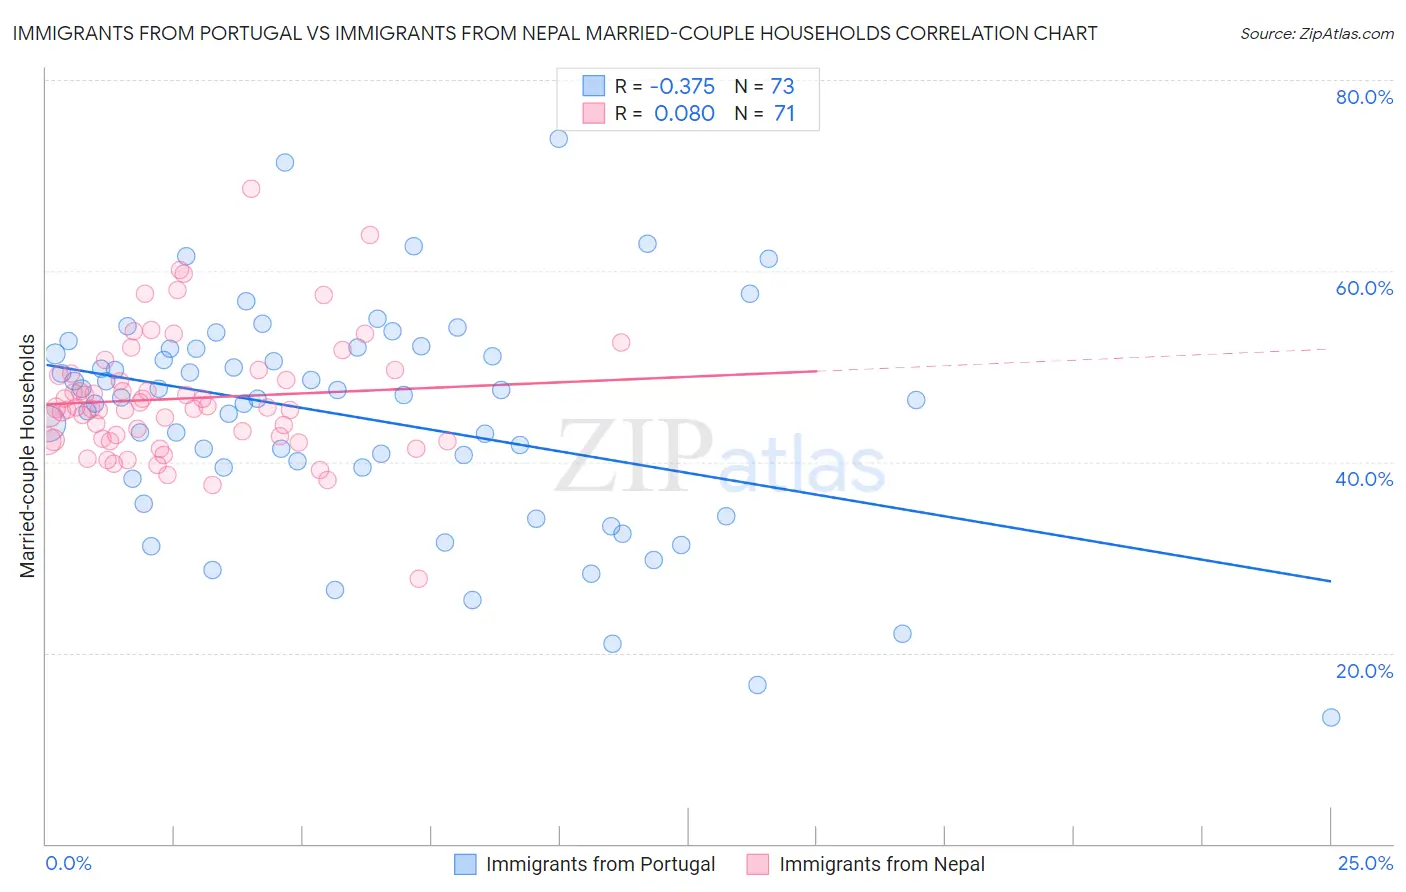
Immigrants from Portugal vs Immigrants from Nepal Married-couple Households Correlation Chart
The statistical analysis conducted on geographies consisting of 174,766,894 people shows a mild negative correlation between the proportion of Immigrants from Portugal and percentage of married-couple family households in the United States with a correlation coefficient (R) of -0.375 and weighted average of 45.2%. Similarly, the statistical analysis conducted on geographies consisting of 186,686,062 people shows a slight positive correlation between the proportion of Immigrants from Nepal and percentage of married-couple family households in the United States with a correlation coefficient (R) of 0.080 and weighted average of 45.2%, a difference of 0.0%.
Married-couple Households Correlation Summary
| Measurement | Immigrants from Portugal | Immigrants from Nepal |
| Minimum | 13.2% | 27.8% |
| Maximum | 73.9% | 68.6% |
| Range | 60.7% | 40.8% |
| Mean | 44.7% | 46.6% |
| Median | 46.8% | 45.6% |
| Interquartile 25% (IQ1) | 38.8% | 42.3% |
| Interquartile 75% (IQ3) | 51.9% | 49.2% |
| Interquartile Range (IQR) | 13.1% | 6.9% |
| Standard Deviation (Sample) | 11.7% | 6.5% |
| Standard Deviation (Population) | 11.6% | 6.5% |
Demographics Similar to Immigrants from Portugal and Immigrants from Nepal by Married-couple Households
In terms of married-couple households, the demographic groups most similar to Immigrants from Portugal are Japanese (45.2%, a difference of 0.020%), Panamanian (45.2%, a difference of 0.020%), Yakama (45.2%, a difference of 0.050%), Immigrants from the Azores (45.2%, a difference of 0.050%), and Nicaraguan (45.2%, a difference of 0.050%). Similarly, the demographic groups most similar to Immigrants from Nepal are Japanese (45.2%, a difference of 0.020%), Panamanian (45.2%, a difference of 0.020%), Yakama (45.2%, a difference of 0.040%), Immigrants from the Azores (45.2%, a difference of 0.050%), and Nicaraguan (45.2%, a difference of 0.060%).
| Demographics | Rating | Rank | Married-couple Households |
| Nepalese | 11.9 /100 | #205 | Poor 45.6% |
| Uruguayans | 10.4 /100 | #206 | Poor 45.5% |
| Immigrants | France | 8.8 /100 | #207 | Tragic 45.4% |
| Hispanics or Latinos | 8.7 /100 | #208 | Tragic 45.4% |
| Immigrants | Uzbekistan | 8.4 /100 | #209 | Tragic 45.4% |
| Cubans | 7.7 /100 | #210 | Tragic 45.4% |
| Immigrants | Spain | 7.3 /100 | #211 | Tragic 45.3% |
| Creek | 6.4 /100 | #212 | Tragic 45.3% |
| Yakama | 5.8 /100 | #213 | Tragic 45.2% |
| Japanese | 5.7 /100 | #214 | Tragic 45.2% |
| Immigrants | Nepal | 5.6 /100 | #215 | Tragic 45.2% |
| Immigrants | Portugal | 5.6 /100 | #216 | Tragic 45.2% |
| Panamanians | 5.5 /100 | #217 | Tragic 45.2% |
| Immigrants | Azores | 5.3 /100 | #218 | Tragic 45.2% |
| Nicaraguans | 5.3 /100 | #219 | Tragic 45.2% |
| Immigrants | Thailand | 5.1 /100 | #220 | Tragic 45.2% |
| Tlingit-Haida | 4.9 /100 | #221 | Tragic 45.1% |
| Immigrants | Laos | 4.6 /100 | #222 | Tragic 45.1% |
| Immigrants | Cambodia | 2.7 /100 | #223 | Tragic 44.9% |
| Immigrants | Micronesia | 2.6 /100 | #224 | Tragic 44.9% |
| Dutch West Indians | 2.6 /100 | #225 | Tragic 44.9% |