Chinese vs Filipino Family Households
COMPARE
Chinese
Filipino
Family Households
Family Households Comparison
Chinese
Filipinos
68.1%
FAMILY HOUSEHOLDS
100.0/ 100
METRIC RATING
17th/ 347
METRIC RANK
65.9%
FAMILY HOUSEHOLDS
99.9/ 100
METRIC RATING
67th/ 347
METRIC RANK
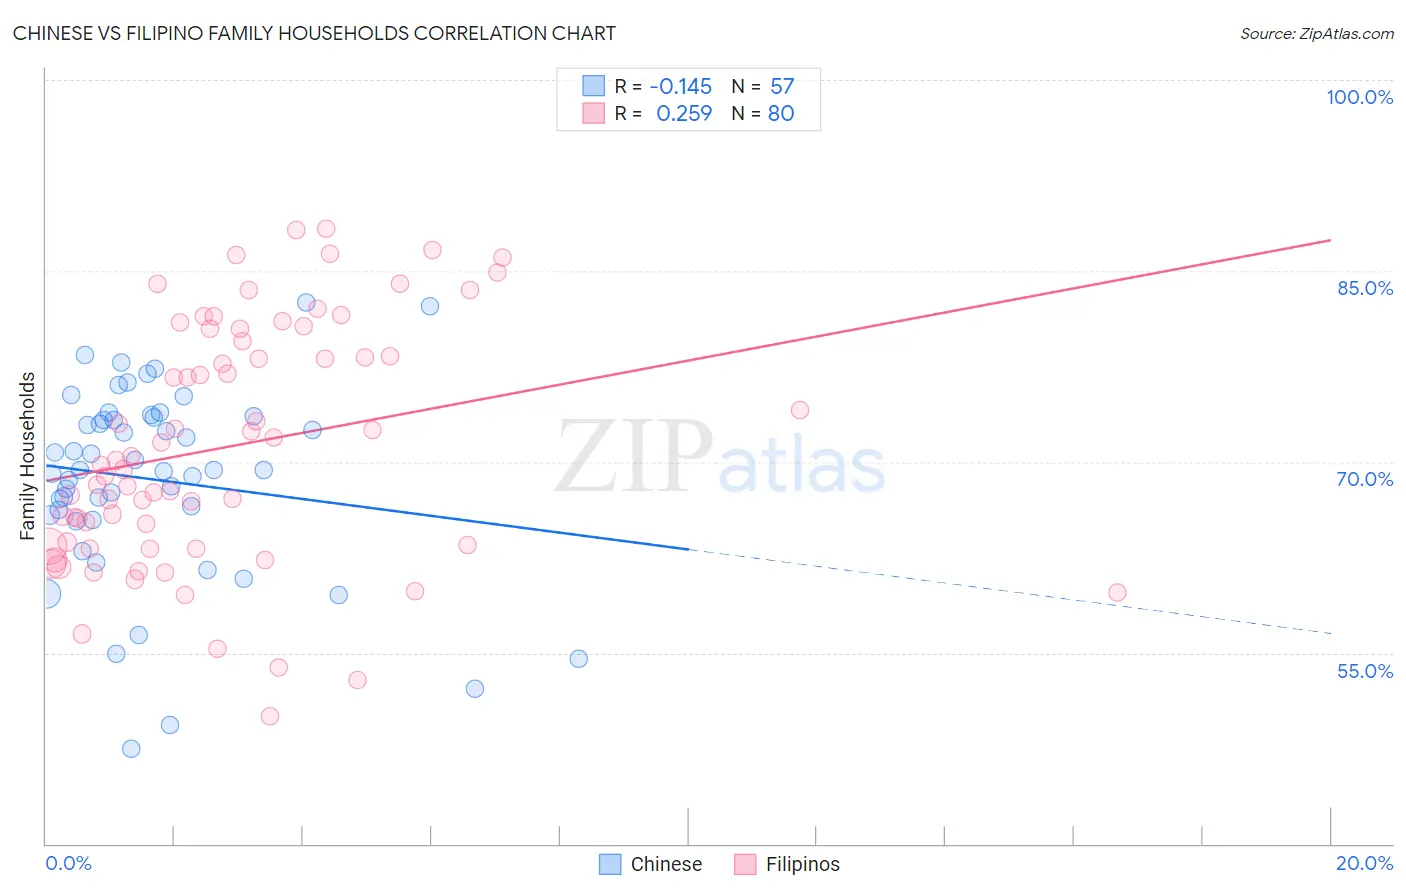
Chinese vs Filipino Family Households Correlation Chart
The statistical analysis conducted on geographies consisting of 64,801,742 people shows a poor negative correlation between the proportion of Chinese and percentage of family households in the United States with a correlation coefficient (R) of -0.145 and weighted average of 68.1%. Similarly, the statistical analysis conducted on geographies consisting of 254,177,261 people shows a weak positive correlation between the proportion of Filipinos and percentage of family households in the United States with a correlation coefficient (R) of 0.259 and weighted average of 65.9%, a difference of 3.4%.
Family Households Correlation Summary
| Measurement | Chinese | Filipino |
| Minimum | 47.5% | 50.0% |
| Maximum | 82.6% | 88.3% |
| Range | 35.1% | 38.3% |
| Mean | 68.6% | 71.2% |
| Median | 69.4% | 69.9% |
| Interquartile 25% (IQ1) | 65.6% | 63.5% |
| Interquartile 75% (IQ3) | 73.5% | 80.0% |
| Interquartile Range (IQR) | 7.9% | 16.5% |
| Standard Deviation (Sample) | 7.6% | 9.4% |
| Standard Deviation (Population) | 7.5% | 9.4% |
Similar Demographics by Family Households
Demographics Similar to Chinese by Family Households
In terms of family households, the demographic groups most similar to Chinese are Immigrants from Vietnam (68.2%, a difference of 0.030%), Assyrian/Chaldean/Syriac (68.2%, a difference of 0.040%), Pueblo (68.2%, a difference of 0.10%), Immigrants from Cuba (68.2%, a difference of 0.10%), and Immigrants from Taiwan (68.0%, a difference of 0.16%).
| Demographics | Rating | Rank | Family Households |
| Immigrants | Philippines | 100.0 /100 | #10 | Exceptional 68.3% |
| Immigrants | Central America | 100.0 /100 | #11 | Exceptional 68.3% |
| Koreans | 100.0 /100 | #12 | Exceptional 68.3% |
| Pueblo | 100.0 /100 | #13 | Exceptional 68.2% |
| Immigrants | Cuba | 100.0 /100 | #14 | Exceptional 68.2% |
| Assyrians/Chaldeans/Syriacs | 100.0 /100 | #15 | Exceptional 68.2% |
| Immigrants | Vietnam | 100.0 /100 | #16 | Exceptional 68.2% |
| Chinese | 100.0 /100 | #17 | Exceptional 68.1% |
| Immigrants | Taiwan | 100.0 /100 | #18 | Exceptional 68.0% |
| Samoans | 100.0 /100 | #19 | Exceptional 67.9% |
| Inupiat | 100.0 /100 | #20 | Exceptional 67.8% |
| Cubans | 100.0 /100 | #21 | Exceptional 67.7% |
| Sri Lankans | 100.0 /100 | #22 | Exceptional 67.7% |
| Immigrants | Pakistan | 100.0 /100 | #23 | Exceptional 67.7% |
| Immigrants | South Eastern Asia | 100.0 /100 | #24 | Exceptional 67.5% |
Demographics Similar to Filipinos by Family Households
In terms of family households, the demographic groups most similar to Filipinos are Fijian (65.9%, a difference of 0.0%), Japanese (65.9%, a difference of 0.020%), Costa Rican (65.9%, a difference of 0.040%), Pima (65.9%, a difference of 0.050%), and Malaysian (65.9%, a difference of 0.050%).
| Demographics | Rating | Rank | Family Households |
| South Americans | 100.0 /100 | #60 | Exceptional 66.0% |
| Danes | 100.0 /100 | #61 | Exceptional 66.0% |
| Central Americans | 100.0 /100 | #62 | Exceptional 66.0% |
| Immigrants | Indonesia | 100.0 /100 | #63 | Exceptional 66.0% |
| Pima | 99.9 /100 | #64 | Exceptional 65.9% |
| Costa Ricans | 99.9 /100 | #65 | Exceptional 65.9% |
| Fijians | 99.9 /100 | #66 | Exceptional 65.9% |
| Filipinos | 99.9 /100 | #67 | Exceptional 65.9% |
| Japanese | 99.9 /100 | #68 | Exceptional 65.9% |
| Malaysians | 99.9 /100 | #69 | Exceptional 65.9% |
| Immigrants | Afghanistan | 99.9 /100 | #70 | Exceptional 65.9% |
| Bhutanese | 99.9 /100 | #71 | Exceptional 65.9% |
| Portuguese | 99.9 /100 | #72 | Exceptional 65.8% |
| Laotians | 99.9 /100 | #73 | Exceptional 65.8% |
| Burmese | 99.9 /100 | #74 | Exceptional 65.7% |