Senegalese vs Filipino Family Households
COMPARE
Senegalese
Filipino
Family Households
Family Households Comparison
Senegalese
Filipinos
59.8%
FAMILY HOUSEHOLDS
0.0/ 100
METRIC RATING
343rd/ 347
METRIC RANK
65.9%
FAMILY HOUSEHOLDS
99.9/ 100
METRIC RATING
67th/ 347
METRIC RANK
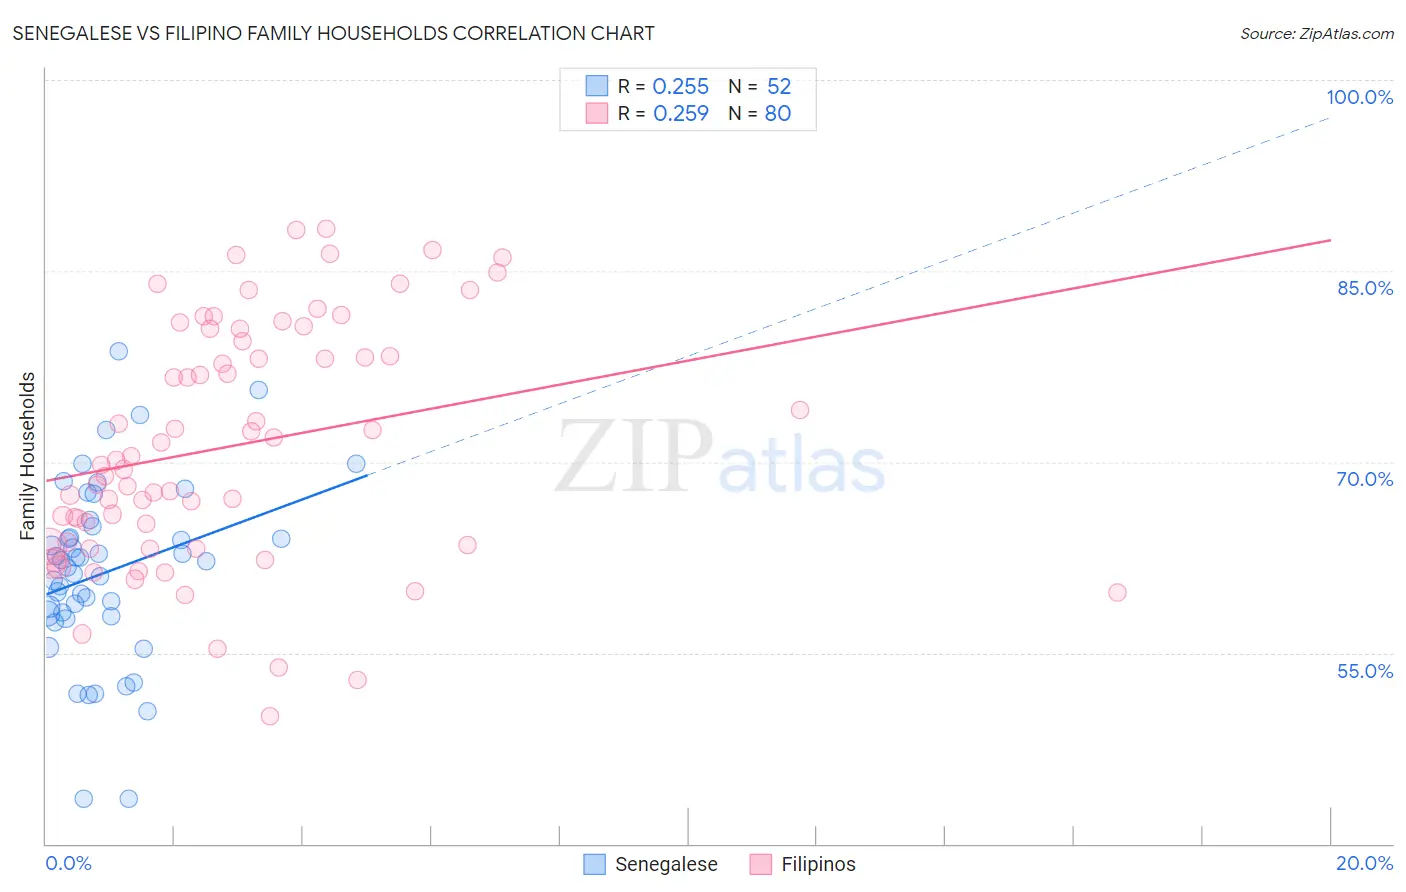
Senegalese vs Filipino Family Households Correlation Chart
The statistical analysis conducted on geographies consisting of 78,113,781 people shows a weak positive correlation between the proportion of Senegalese and percentage of family households in the United States with a correlation coefficient (R) of 0.255 and weighted average of 59.8%. Similarly, the statistical analysis conducted on geographies consisting of 254,177,261 people shows a weak positive correlation between the proportion of Filipinos and percentage of family households in the United States with a correlation coefficient (R) of 0.259 and weighted average of 65.9%, a difference of 10.2%.
Family Households Correlation Summary
| Measurement | Senegalese | Filipino |
| Minimum | 43.5% | 50.0% |
| Maximum | 78.7% | 88.3% |
| Range | 35.1% | 38.3% |
| Mean | 61.3% | 71.2% |
| Median | 61.9% | 69.9% |
| Interquartile 25% (IQ1) | 58.0% | 63.5% |
| Interquartile 75% (IQ3) | 64.5% | 80.0% |
| Interquartile Range (IQR) | 6.5% | 16.5% |
| Standard Deviation (Sample) | 7.1% | 9.4% |
| Standard Deviation (Population) | 7.0% | 9.4% |
Similar Demographics by Family Households
Demographics Similar to Senegalese by Family Households
In terms of family households, the demographic groups most similar to Senegalese are Sudanese (60.0%, a difference of 0.30%), Immigrants from Senegal (60.1%, a difference of 0.48%), Immigrants from Sudan (60.2%, a difference of 0.57%), Immigrants from Congo (59.2%, a difference of 0.97%), and Immigrants from Zaire (59.2%, a difference of 1.1%).
| Demographics | Rating | Rank | Family Households |
| Immigrants | Ethiopia | 0.0 /100 | #333 | Tragic 61.2% |
| Immigrants | Eastern Africa | 0.0 /100 | #334 | Tragic 61.1% |
| Carpatho Rusyns | 0.0 /100 | #335 | Tragic 61.1% |
| German Russians | 0.0 /100 | #336 | Tragic 60.9% |
| Soviet Union | 0.0 /100 | #337 | Tragic 60.9% |
| Immigrants | Eritrea | 0.0 /100 | #338 | Tragic 60.8% |
| Immigrants | Saudi Arabia | 0.0 /100 | #339 | Tragic 60.7% |
| Immigrants | Sudan | 0.0 /100 | #340 | Tragic 60.2% |
| Immigrants | Senegal | 0.0 /100 | #341 | Tragic 60.1% |
| Sudanese | 0.0 /100 | #342 | Tragic 60.0% |
| Senegalese | 0.0 /100 | #343 | Tragic 59.8% |
| Immigrants | Congo | 0.0 /100 | #344 | Tragic 59.2% |
| Immigrants | Zaire | 0.0 /100 | #345 | Tragic 59.2% |
| Somalis | 0.0 /100 | #346 | Tragic 57.6% |
| Immigrants | Somalia | 0.0 /100 | #347 | Tragic 56.7% |
Demographics Similar to Filipinos by Family Households
In terms of family households, the demographic groups most similar to Filipinos are Fijian (65.9%, a difference of 0.0%), Japanese (65.9%, a difference of 0.020%), Costa Rican (65.9%, a difference of 0.040%), Pima (65.9%, a difference of 0.050%), and Malaysian (65.9%, a difference of 0.050%).
| Demographics | Rating | Rank | Family Households |
| South Americans | 100.0 /100 | #60 | Exceptional 66.0% |
| Danes | 100.0 /100 | #61 | Exceptional 66.0% |
| Central Americans | 100.0 /100 | #62 | Exceptional 66.0% |
| Immigrants | Indonesia | 100.0 /100 | #63 | Exceptional 66.0% |
| Pima | 99.9 /100 | #64 | Exceptional 65.9% |
| Costa Ricans | 99.9 /100 | #65 | Exceptional 65.9% |
| Fijians | 99.9 /100 | #66 | Exceptional 65.9% |
| Filipinos | 99.9 /100 | #67 | Exceptional 65.9% |
| Japanese | 99.9 /100 | #68 | Exceptional 65.9% |
| Malaysians | 99.9 /100 | #69 | Exceptional 65.9% |
| Immigrants | Afghanistan | 99.9 /100 | #70 | Exceptional 65.9% |
| Bhutanese | 99.9 /100 | #71 | Exceptional 65.9% |
| Portuguese | 99.9 /100 | #72 | Exceptional 65.8% |
| Laotians | 99.9 /100 | #73 | Exceptional 65.8% |
| Burmese | 99.9 /100 | #74 | Exceptional 65.7% |