Immigrants from Northern Africa vs Dominican Currently Married
COMPARE
Immigrants from Northern Africa
Dominican
Currently Married
Currently Married Comparison
Immigrants from Northern Africa
Dominicans
46.5%
CURRENTLY MARRIED
39.7/ 100
METRIC RATING
183rd/ 347
METRIC RANK
39.5%
CURRENTLY MARRIED
0.0/ 100
METRIC RATING
339th/ 347
METRIC RANK
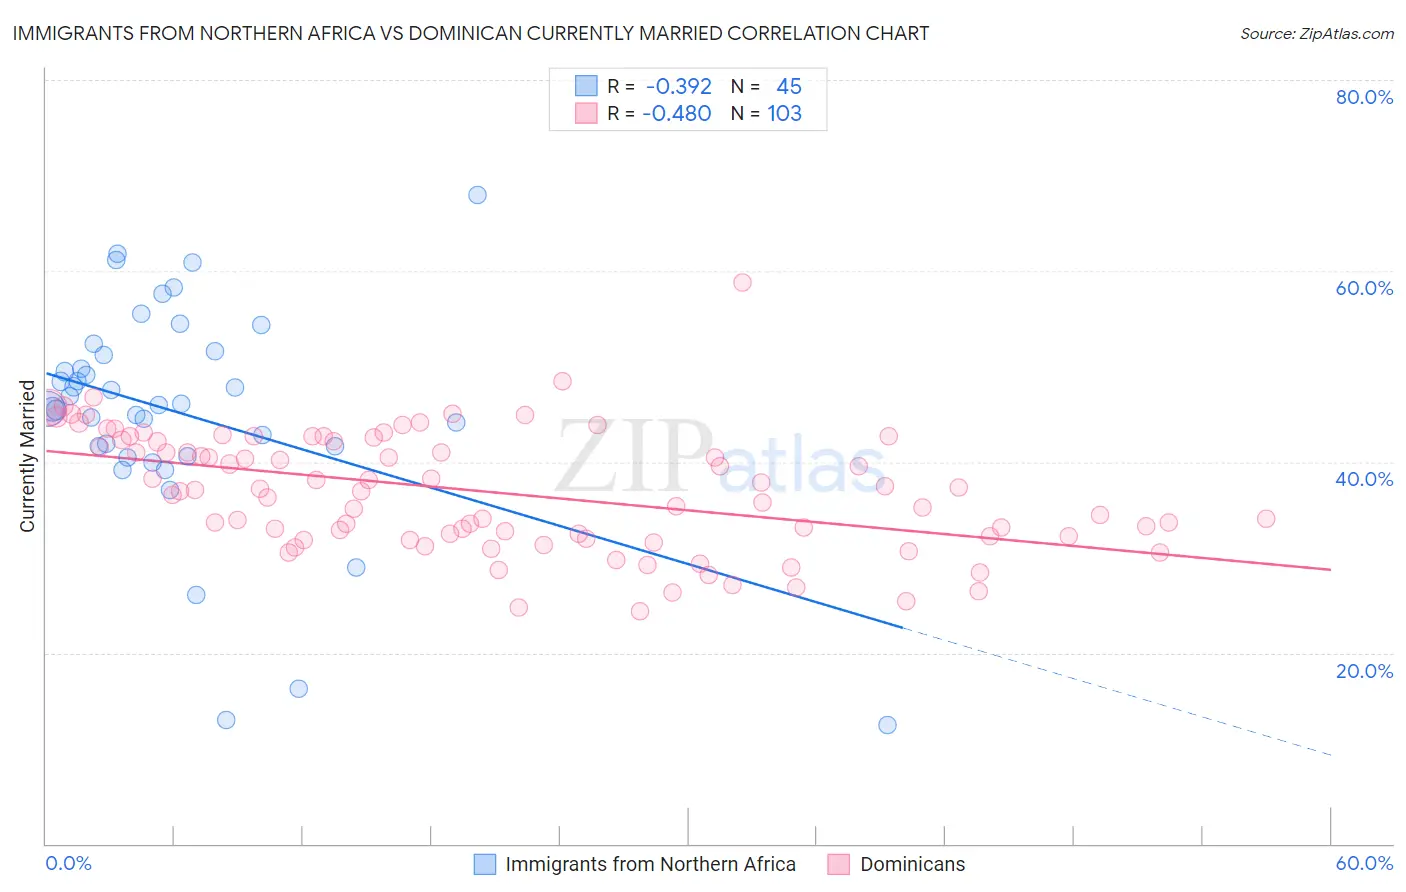
Immigrants from Northern Africa vs Dominican Currently Married Correlation Chart
The statistical analysis conducted on geographies consisting of 321,174,675 people shows a mild negative correlation between the proportion of Immigrants from Northern Africa and percentage of population currently married in the United States with a correlation coefficient (R) of -0.392 and weighted average of 46.5%. Similarly, the statistical analysis conducted on geographies consisting of 355,078,950 people shows a moderate negative correlation between the proportion of Dominicans and percentage of population currently married in the United States with a correlation coefficient (R) of -0.480 and weighted average of 39.5%, a difference of 17.5%.
Currently Married Correlation Summary
| Measurement | Immigrants from Northern Africa | Dominican |
| Minimum | 12.5% | 24.4% |
| Maximum | 67.9% | 58.8% |
| Range | 55.4% | 34.4% |
| Mean | 45.1% | 36.9% |
| Median | 45.9% | 37.0% |
| Interquartile 25% (IQ1) | 41.1% | 32.2% |
| Interquartile 75% (IQ3) | 51.4% | 42.3% |
| Interquartile Range (IQR) | 10.3% | 10.1% |
| Standard Deviation (Sample) | 11.6% | 6.3% |
| Standard Deviation (Population) | 11.5% | 6.2% |
Similar Demographics by Currently Married
Demographics Similar to Immigrants from Northern Africa by Currently Married
In terms of currently married, the demographic groups most similar to Immigrants from Northern Africa are Brazilian (46.4%, a difference of 0.020%), Potawatomi (46.5%, a difference of 0.080%), Mongolian (46.4%, a difference of 0.080%), Immigrants from Chile (46.4%, a difference of 0.11%), and Ottawa (46.5%, a difference of 0.13%).
| Demographics | Rating | Rank | Currently Married |
| Hawaiians | 48.6 /100 | #176 | Average 46.6% |
| Israelis | 48.6 /100 | #177 | Average 46.6% |
| Chickasaw | 47.8 /100 | #178 | Average 46.6% |
| Immigrants | Oceania | 44.6 /100 | #179 | Average 46.5% |
| Costa Ricans | 43.7 /100 | #180 | Average 46.5% |
| Ottawa | 43.0 /100 | #181 | Average 46.5% |
| Potawatomi | 41.9 /100 | #182 | Average 46.5% |
| Immigrants | Northern Africa | 39.7 /100 | #183 | Fair 46.5% |
| Brazilians | 39.3 /100 | #184 | Fair 46.4% |
| Mongolians | 37.6 /100 | #185 | Fair 46.4% |
| Immigrants | Chile | 36.8 /100 | #186 | Fair 46.4% |
| Immigrants | Peru | 35.3 /100 | #187 | Fair 46.4% |
| Colombians | 31.8 /100 | #188 | Fair 46.3% |
| Fijians | 30.3 /100 | #189 | Fair 46.3% |
| Choctaw | 29.1 /100 | #190 | Fair 46.3% |
Demographics Similar to Dominicans by Currently Married
In terms of currently married, the demographic groups most similar to Dominicans are Cape Verdean (39.6%, a difference of 0.15%), Black/African American (39.6%, a difference of 0.25%), British West Indian (39.8%, a difference of 0.63%), Lumbee (39.8%, a difference of 0.80%), and Immigrants from Grenada (39.1%, a difference of 0.96%).
| Demographics | Rating | Rank | Currently Married |
| Immigrants | St. Vincent and the Grenadines | 0.0 /100 | #332 | Tragic 40.1% |
| Yup'ik | 0.0 /100 | #333 | Tragic 39.9% |
| Puerto Ricans | 0.0 /100 | #334 | Tragic 39.9% |
| Lumbee | 0.0 /100 | #335 | Tragic 39.8% |
| British West Indians | 0.0 /100 | #336 | Tragic 39.8% |
| Blacks/African Americans | 0.0 /100 | #337 | Tragic 39.6% |
| Cape Verdeans | 0.0 /100 | #338 | Tragic 39.6% |
| Dominicans | 0.0 /100 | #339 | Tragic 39.5% |
| Immigrants | Grenada | 0.0 /100 | #340 | Tragic 39.1% |
| Navajo | 0.0 /100 | #341 | Tragic 39.0% |
| Immigrants | Dominican Republic | 0.0 /100 | #342 | Tragic 38.9% |
| Pueblo | 0.0 /100 | #343 | Tragic 38.2% |
| Immigrants | Cabo Verde | 0.0 /100 | #344 | Tragic 37.8% |
| Tohono O'odham | 0.0 /100 | #345 | Tragic 36.8% |
| Hopi | 0.0 /100 | #346 | Tragic 36.5% |