British West Indian vs Lithuanian Family Households
COMPARE
British West Indian
Lithuanian
Family Households
Family Households Comparison
British West Indians
Lithuanians
62.8%
FAMILY HOUSEHOLDS
0.1/ 100
METRIC RATING
286th/ 347
METRIC RANK
64.0%
FAMILY HOUSEHOLDS
23.8/ 100
METRIC RATING
192nd/ 347
METRIC RANK
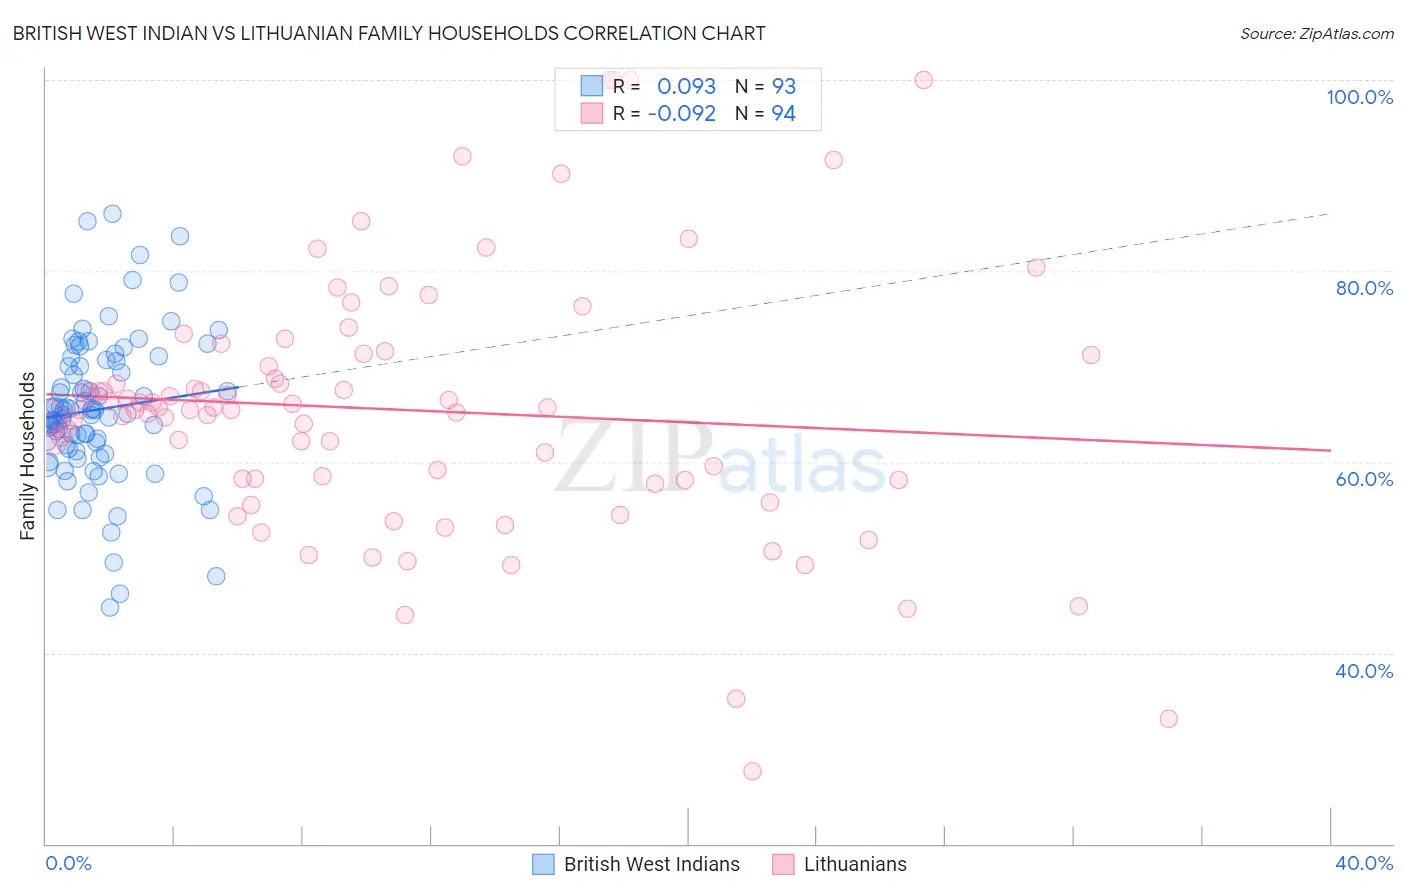
British West Indian vs Lithuanian Family Households Correlation Chart
The statistical analysis conducted on geographies consisting of 152,638,699 people shows a slight positive correlation between the proportion of British West Indians and percentage of family households in the United States with a correlation coefficient (R) of 0.093 and weighted average of 62.8%. Similarly, the statistical analysis conducted on geographies consisting of 421,743,433 people shows a slight negative correlation between the proportion of Lithuanians and percentage of family households in the United States with a correlation coefficient (R) of -0.092 and weighted average of 64.0%, a difference of 2.1%.
Family Households Correlation Summary
| Measurement | British West Indian | Lithuanian |
| Minimum | 44.8% | 27.6% |
| Maximum | 86.0% | 100.0% |
| Range | 41.2% | 72.4% |
| Mean | 65.5% | 65.5% |
| Median | 65.0% | 65.5% |
| Interquartile 25% (IQ1) | 61.2% | 58.1% |
| Interquartile 75% (IQ3) | 70.6% | 71.3% |
| Interquartile Range (IQR) | 9.4% | 13.1% |
| Standard Deviation (Sample) | 7.8% | 13.6% |
| Standard Deviation (Population) | 7.7% | 13.6% |
Similar Demographics by Family Households
Demographics Similar to British West Indians by Family Households
In terms of family households, the demographic groups most similar to British West Indians are Latvian (62.8%, a difference of 0.0%), Immigrants from Uganda (62.7%, a difference of 0.020%), Mongolian (62.8%, a difference of 0.030%), Immigrants from Nepal (62.7%, a difference of 0.11%), and Australian (62.8%, a difference of 0.13%).
| Demographics | Rating | Rank | Family Households |
| Immigrants | Yemen | 0.2 /100 | #279 | Tragic 63.0% |
| Immigrants | Bulgaria | 0.2 /100 | #280 | Tragic 63.0% |
| Estonians | 0.2 /100 | #281 | Tragic 62.9% |
| New Zealanders | 0.1 /100 | #282 | Tragic 62.9% |
| Immigrants | Denmark | 0.1 /100 | #283 | Tragic 62.9% |
| Australians | 0.1 /100 | #284 | Tragic 62.8% |
| Mongolians | 0.1 /100 | #285 | Tragic 62.8% |
| British West Indians | 0.1 /100 | #286 | Tragic 62.8% |
| Latvians | 0.1 /100 | #287 | Tragic 62.8% |
| Immigrants | Uganda | 0.1 /100 | #288 | Tragic 62.7% |
| Immigrants | Nepal | 0.1 /100 | #289 | Tragic 62.7% |
| Immigrants | Grenada | 0.0 /100 | #290 | Tragic 62.6% |
| U.S. Virgin Islanders | 0.0 /100 | #291 | Tragic 62.6% |
| Immigrants | Burma/Myanmar | 0.0 /100 | #292 | Tragic 62.6% |
| Immigrants | Sweden | 0.0 /100 | #293 | Tragic 62.5% |
Demographics Similar to Lithuanians by Family Households
In terms of family households, the demographic groups most similar to Lithuanians are French (64.0%, a difference of 0.0%), Arab (64.1%, a difference of 0.010%), Zimbabwean (64.1%, a difference of 0.020%), Immigrants from Western Asia (64.1%, a difference of 0.030%), and Paiute (64.0%, a difference of 0.030%).
| Demographics | Rating | Rank | Family Households |
| Immigrants | Iran | 30.4 /100 | #185 | Fair 64.1% |
| Spanish Americans | 30.1 /100 | #186 | Fair 64.1% |
| Northern Europeans | 28.2 /100 | #187 | Fair 64.1% |
| Paraguayans | 26.7 /100 | #188 | Fair 64.1% |
| Immigrants | Western Asia | 25.3 /100 | #189 | Fair 64.1% |
| Zimbabweans | 24.7 /100 | #190 | Fair 64.1% |
| Arabs | 24.5 /100 | #191 | Fair 64.1% |
| Lithuanians | 23.8 /100 | #192 | Fair 64.0% |
| French | 23.7 /100 | #193 | Fair 64.0% |
| Paiute | 22.2 /100 | #194 | Fair 64.0% |
| Immigrants | North America | 20.0 /100 | #195 | Poor 64.0% |
| Immigrants | Canada | 19.2 /100 | #196 | Poor 64.0% |
| Seminole | 18.9 /100 | #197 | Poor 64.0% |
| Poles | 18.9 /100 | #198 | Poor 64.0% |
| Slavs | 18.6 /100 | #199 | Poor 64.0% |