Cheyenne vs Lithuanian Family Households
COMPARE
Cheyenne
Lithuanian
Family Households
Family Households Comparison
Cheyenne
Lithuanians
63.2%
FAMILY HOUSEHOLDS
0.5/ 100
METRIC RATING
263rd/ 347
METRIC RANK
64.0%
FAMILY HOUSEHOLDS
23.8/ 100
METRIC RATING
192nd/ 347
METRIC RANK
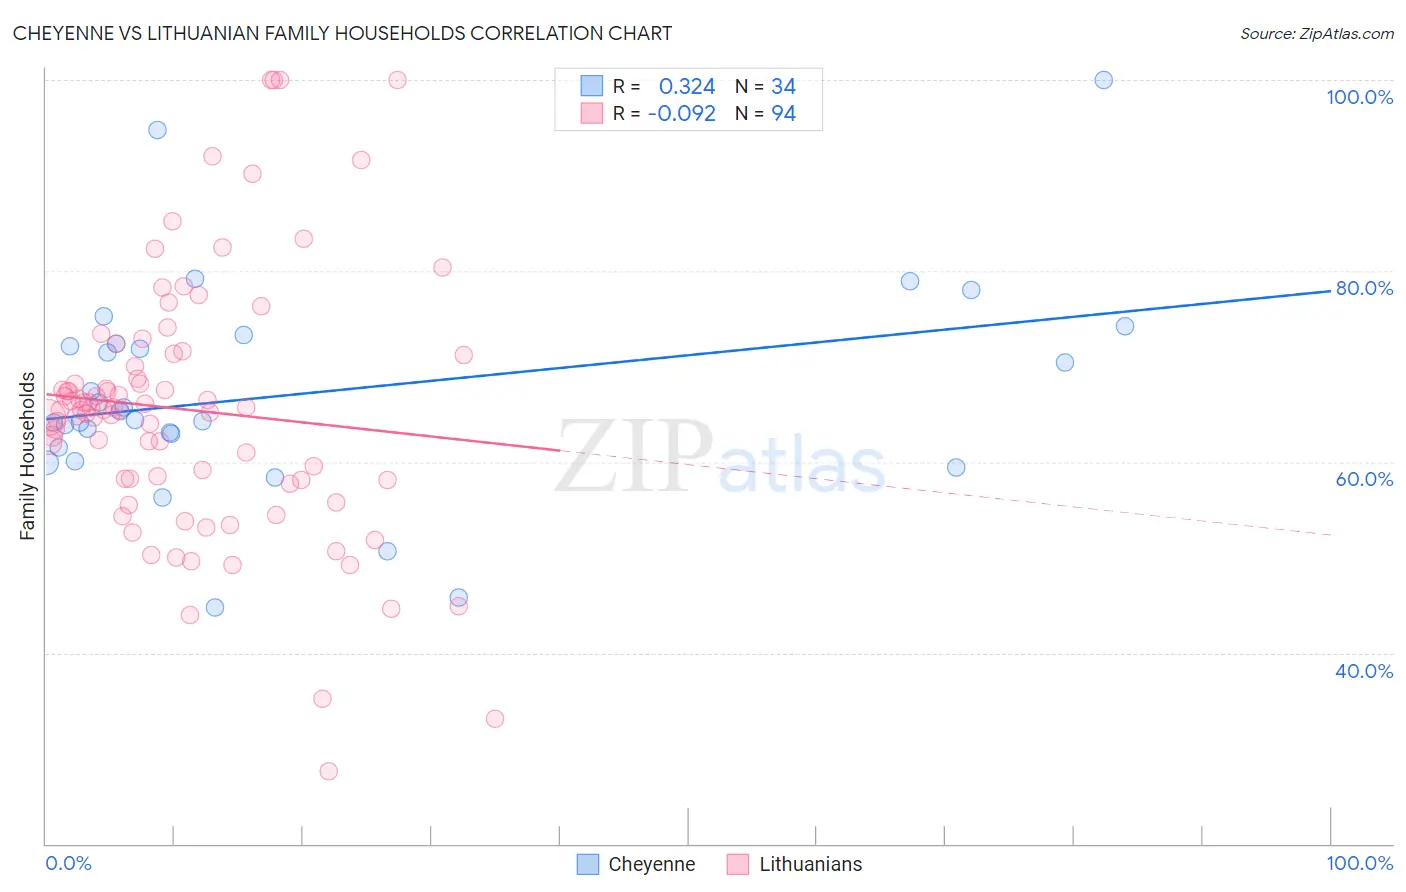
Cheyenne vs Lithuanian Family Households Correlation Chart
The statistical analysis conducted on geographies consisting of 80,705,196 people shows a mild positive correlation between the proportion of Cheyenne and percentage of family households in the United States with a correlation coefficient (R) of 0.324 and weighted average of 63.2%. Similarly, the statistical analysis conducted on geographies consisting of 421,743,433 people shows a slight negative correlation between the proportion of Lithuanians and percentage of family households in the United States with a correlation coefficient (R) of -0.092 and weighted average of 64.0%, a difference of 1.4%.
Family Households Correlation Summary
| Measurement | Cheyenne | Lithuanian |
| Minimum | 44.8% | 27.6% |
| Maximum | 100.0% | 100.0% |
| Range | 55.2% | 72.4% |
| Mean | 67.2% | 65.5% |
| Median | 64.9% | 65.5% |
| Interquartile 25% (IQ1) | 61.5% | 58.1% |
| Interquartile 75% (IQ3) | 72.3% | 71.3% |
| Interquartile Range (IQR) | 10.9% | 13.1% |
| Standard Deviation (Sample) | 11.3% | 13.6% |
| Standard Deviation (Population) | 11.1% | 13.6% |
Similar Demographics by Family Households
Demographics Similar to Cheyenne by Family Households
In terms of family households, the demographic groups most similar to Cheyenne are Kenyan (63.2%, a difference of 0.010%), Immigrants from Ireland (63.2%, a difference of 0.020%), Colville (63.2%, a difference of 0.020%), Immigrants from Western Africa (63.1%, a difference of 0.020%), and Immigrants from Russia (63.2%, a difference of 0.030%).
| Demographics | Rating | Rank | Family Households |
| Luxembourgers | 0.9 /100 | #256 | Tragic 63.3% |
| Icelanders | 0.8 /100 | #257 | Tragic 63.3% |
| Immigrants | Barbados | 0.7 /100 | #258 | Tragic 63.2% |
| Immigrants | Western Europe | 0.6 /100 | #259 | Tragic 63.2% |
| Cypriots | 0.6 /100 | #260 | Tragic 63.2% |
| Immigrants | Russia | 0.6 /100 | #261 | Tragic 63.2% |
| Immigrants | Ireland | 0.6 /100 | #262 | Tragic 63.2% |
| Cheyenne | 0.5 /100 | #263 | Tragic 63.2% |
| Kenyans | 0.5 /100 | #264 | Tragic 63.2% |
| Colville | 0.5 /100 | #265 | Tragic 63.2% |
| Immigrants | Western Africa | 0.5 /100 | #266 | Tragic 63.1% |
| Israelis | 0.4 /100 | #267 | Tragic 63.1% |
| Immigrants | Singapore | 0.4 /100 | #268 | Tragic 63.1% |
| Yugoslavians | 0.4 /100 | #269 | Tragic 63.1% |
| Immigrants | Austria | 0.3 /100 | #270 | Tragic 63.1% |
Demographics Similar to Lithuanians by Family Households
In terms of family households, the demographic groups most similar to Lithuanians are French (64.0%, a difference of 0.0%), Arab (64.1%, a difference of 0.010%), Zimbabwean (64.1%, a difference of 0.020%), Immigrants from Western Asia (64.1%, a difference of 0.030%), and Paiute (64.0%, a difference of 0.030%).
| Demographics | Rating | Rank | Family Households |
| Immigrants | Iran | 30.4 /100 | #185 | Fair 64.1% |
| Spanish Americans | 30.1 /100 | #186 | Fair 64.1% |
| Northern Europeans | 28.2 /100 | #187 | Fair 64.1% |
| Paraguayans | 26.7 /100 | #188 | Fair 64.1% |
| Immigrants | Western Asia | 25.3 /100 | #189 | Fair 64.1% |
| Zimbabweans | 24.7 /100 | #190 | Fair 64.1% |
| Arabs | 24.5 /100 | #191 | Fair 64.1% |
| Lithuanians | 23.8 /100 | #192 | Fair 64.0% |
| French | 23.7 /100 | #193 | Fair 64.0% |
| Paiute | 22.2 /100 | #194 | Fair 64.0% |
| Immigrants | North America | 20.0 /100 | #195 | Poor 64.0% |
| Immigrants | Canada | 19.2 /100 | #196 | Poor 64.0% |
| Seminole | 18.9 /100 | #197 | Poor 64.0% |
| Poles | 18.9 /100 | #198 | Poor 64.0% |
| Slavs | 18.6 /100 | #199 | Poor 64.0% |