Immigrants from Haiti vs Lithuanian Family Households
COMPARE
Immigrants from Haiti
Lithuanian
Family Households
Family Households Comparison
Immigrants from Haiti
Lithuanians
65.3%
FAMILY HOUSEHOLDS
99.1/ 100
METRIC RATING
88th/ 347
METRIC RANK
64.0%
FAMILY HOUSEHOLDS
23.8/ 100
METRIC RATING
192nd/ 347
METRIC RANK
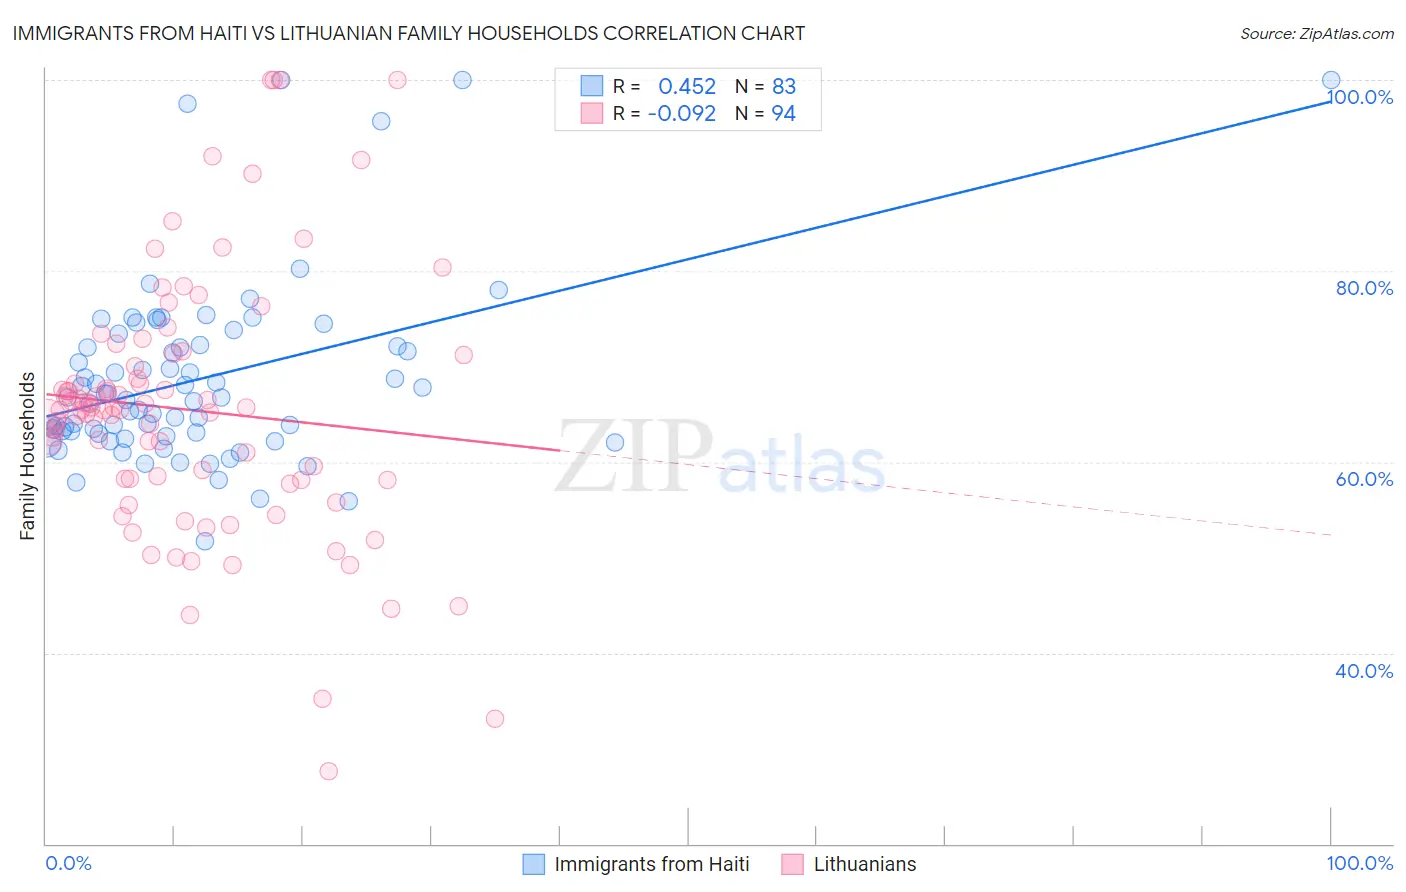
Immigrants from Haiti vs Lithuanian Family Households Correlation Chart
The statistical analysis conducted on geographies consisting of 225,175,344 people shows a moderate positive correlation between the proportion of Immigrants from Haiti and percentage of family households in the United States with a correlation coefficient (R) of 0.452 and weighted average of 65.3%. Similarly, the statistical analysis conducted on geographies consisting of 421,743,433 people shows a slight negative correlation between the proportion of Lithuanians and percentage of family households in the United States with a correlation coefficient (R) of -0.092 and weighted average of 64.0%, a difference of 2.0%.
Family Households Correlation Summary
| Measurement | Immigrants from Haiti | Lithuanian |
| Minimum | 51.7% | 27.6% |
| Maximum | 100.0% | 100.0% |
| Range | 48.3% | 72.4% |
| Mean | 68.7% | 65.5% |
| Median | 66.8% | 65.5% |
| Interquartile 25% (IQ1) | 63.0% | 58.1% |
| Interquartile 75% (IQ3) | 72.3% | 71.3% |
| Interquartile Range (IQR) | 9.3% | 13.1% |
| Standard Deviation (Sample) | 9.6% | 13.6% |
| Standard Deviation (Population) | 9.5% | 13.6% |
Similar Demographics by Family Households
Demographics Similar to Immigrants from Haiti by Family Households
In terms of family households, the demographic groups most similar to Immigrants from Haiti are Immigrants from Caribbean (65.3%, a difference of 0.010%), Immigrants from Laos (65.3%, a difference of 0.020%), Immigrants from Egypt (65.3%, a difference of 0.030%), Crow (65.3%, a difference of 0.070%), and Hopi (65.3%, a difference of 0.11%).
| Demographics | Rating | Rank | Family Households |
| Jordanians | 99.7 /100 | #81 | Exceptional 65.5% |
| Immigrants | Lebanon | 99.7 /100 | #82 | Exceptional 65.5% |
| Immigrants | Guyana | 99.6 /100 | #83 | Exceptional 65.5% |
| Americans | 99.6 /100 | #84 | Exceptional 65.5% |
| Immigrants | Cambodia | 99.5 /100 | #85 | Exceptional 65.4% |
| Egyptians | 99.4 /100 | #86 | Exceptional 65.4% |
| Immigrants | Egypt | 99.2 /100 | #87 | Exceptional 65.3% |
| Immigrants | Haiti | 99.1 /100 | #88 | Exceptional 65.3% |
| Immigrants | Caribbean | 99.1 /100 | #89 | Exceptional 65.3% |
| Immigrants | Laos | 99.1 /100 | #90 | Exceptional 65.3% |
| Crow | 98.9 /100 | #91 | Exceptional 65.3% |
| Hopi | 98.8 /100 | #92 | Exceptional 65.3% |
| Guyanese | 98.8 /100 | #93 | Exceptional 65.3% |
| Immigrants | Poland | 98.7 /100 | #94 | Exceptional 65.2% |
| Immigrants | Portugal | 98.6 /100 | #95 | Exceptional 65.2% |
Demographics Similar to Lithuanians by Family Households
In terms of family households, the demographic groups most similar to Lithuanians are French (64.0%, a difference of 0.0%), Arab (64.1%, a difference of 0.010%), Zimbabwean (64.1%, a difference of 0.020%), Immigrants from Western Asia (64.1%, a difference of 0.030%), and Paiute (64.0%, a difference of 0.030%).
| Demographics | Rating | Rank | Family Households |
| Immigrants | Iran | 30.4 /100 | #185 | Fair 64.1% |
| Spanish Americans | 30.1 /100 | #186 | Fair 64.1% |
| Northern Europeans | 28.2 /100 | #187 | Fair 64.1% |
| Paraguayans | 26.7 /100 | #188 | Fair 64.1% |
| Immigrants | Western Asia | 25.3 /100 | #189 | Fair 64.1% |
| Zimbabweans | 24.7 /100 | #190 | Fair 64.1% |
| Arabs | 24.5 /100 | #191 | Fair 64.1% |
| Lithuanians | 23.8 /100 | #192 | Fair 64.0% |
| French | 23.7 /100 | #193 | Fair 64.0% |
| Paiute | 22.2 /100 | #194 | Fair 64.0% |
| Immigrants | North America | 20.0 /100 | #195 | Poor 64.0% |
| Immigrants | Canada | 19.2 /100 | #196 | Poor 64.0% |
| Seminole | 18.9 /100 | #197 | Poor 64.0% |
| Poles | 18.9 /100 | #198 | Poor 64.0% |
| Slavs | 18.6 /100 | #199 | Poor 64.0% |