Immigrants from Germany vs Lithuanian Family Households
COMPARE
Immigrants from Germany
Lithuanian
Family Households
Family Households Comparison
Immigrants from Germany
Lithuanians
64.3%
FAMILY HOUSEHOLDS
50.0/ 100
METRIC RATING
174th/ 347
METRIC RANK
64.0%
FAMILY HOUSEHOLDS
23.8/ 100
METRIC RATING
192nd/ 347
METRIC RANK
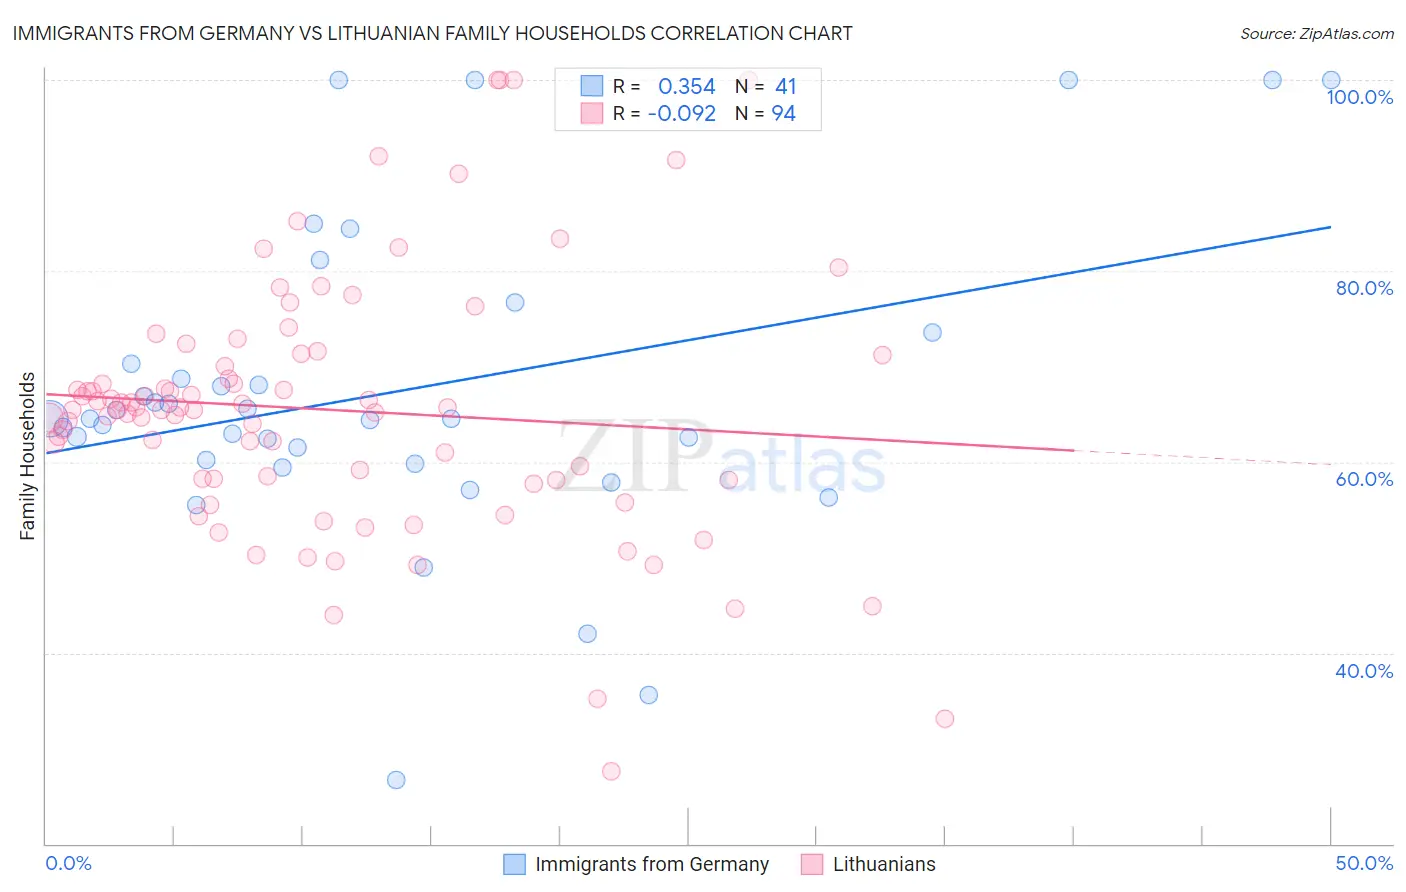
Immigrants from Germany vs Lithuanian Family Households Correlation Chart
The statistical analysis conducted on geographies consisting of 463,759,917 people shows a mild positive correlation between the proportion of Immigrants from Germany and percentage of family households in the United States with a correlation coefficient (R) of 0.354 and weighted average of 64.3%. Similarly, the statistical analysis conducted on geographies consisting of 421,743,433 people shows a slight negative correlation between the proportion of Lithuanians and percentage of family households in the United States with a correlation coefficient (R) of -0.092 and weighted average of 64.0%, a difference of 0.39%.
Family Households Correlation Summary
| Measurement | Immigrants from Germany | Lithuanian |
| Minimum | 26.7% | 27.6% |
| Maximum | 100.0% | 100.0% |
| Range | 73.3% | 72.4% |
| Mean | 67.4% | 65.5% |
| Median | 64.5% | 65.5% |
| Interquartile 25% (IQ1) | 60.0% | 58.1% |
| Interquartile 75% (IQ3) | 71.9% | 71.3% |
| Interquartile Range (IQR) | 11.9% | 13.1% |
| Standard Deviation (Sample) | 16.4% | 13.6% |
| Standard Deviation (Population) | 16.2% | 13.6% |
Demographics Similar to Immigrants from Germany and Lithuanians by Family Households
In terms of family households, the demographic groups most similar to Immigrants from Germany are Immigrants from Sierra Leone (64.3%, a difference of 0.030%), Bangladeshi (64.3%, a difference of 0.080%), Vietnamese (64.2%, a difference of 0.090%), Immigrants from Micronesia (64.2%, a difference of 0.10%), and Jamaican (64.2%, a difference of 0.13%). Similarly, the demographic groups most similar to Lithuanians are French (64.0%, a difference of 0.0%), Arab (64.1%, a difference of 0.010%), Zimbabwean (64.1%, a difference of 0.020%), Immigrants from Western Asia (64.1%, a difference of 0.030%), and Paraguayan (64.1%, a difference of 0.050%).
| Demographics | Rating | Rank | Family Households |
| Immigrants | Sierra Leone | 52.5 /100 | #173 | Average 64.3% |
| Immigrants | Germany | 50.0 /100 | #174 | Average 64.3% |
| Bangladeshis | 44.3 /100 | #175 | Average 64.3% |
| Vietnamese | 43.6 /100 | #176 | Average 64.2% |
| Immigrants | Micronesia | 42.3 /100 | #177 | Average 64.2% |
| Jamaicans | 40.6 /100 | #178 | Average 64.2% |
| Immigrants | Ukraine | 38.2 /100 | #179 | Fair 64.2% |
| Immigrants | Honduras | 35.0 /100 | #180 | Fair 64.2% |
| Immigrants | Trinidad and Tobago | 34.9 /100 | #181 | Fair 64.2% |
| Ukrainians | 34.6 /100 | #182 | Fair 64.2% |
| Creek | 34.1 /100 | #183 | Fair 64.2% |
| Puerto Ricans | 33.4 /100 | #184 | Fair 64.2% |
| Immigrants | Iran | 30.4 /100 | #185 | Fair 64.1% |
| Spanish Americans | 30.1 /100 | #186 | Fair 64.1% |
| Northern Europeans | 28.2 /100 | #187 | Fair 64.1% |
| Paraguayans | 26.7 /100 | #188 | Fair 64.1% |
| Immigrants | Western Asia | 25.3 /100 | #189 | Fair 64.1% |
| Zimbabweans | 24.7 /100 | #190 | Fair 64.1% |
| Arabs | 24.5 /100 | #191 | Fair 64.1% |
| Lithuanians | 23.8 /100 | #192 | Fair 64.0% |
| French | 23.7 /100 | #193 | Fair 64.0% |