Immigrants from Nigeria vs Indonesian Bachelor's Degree
COMPARE
Immigrants from Nigeria
Indonesian
Bachelor's Degree
Bachelor's Degree Comparison
Immigrants from Nigeria
Indonesians
36.7%
BACHELOR'S DEGREE
23.1/ 100
METRIC RATING
203rd/ 347
METRIC RANK
33.5%
BACHELOR'S DEGREE
0.9/ 100
METRIC RATING
250th/ 347
METRIC RANK
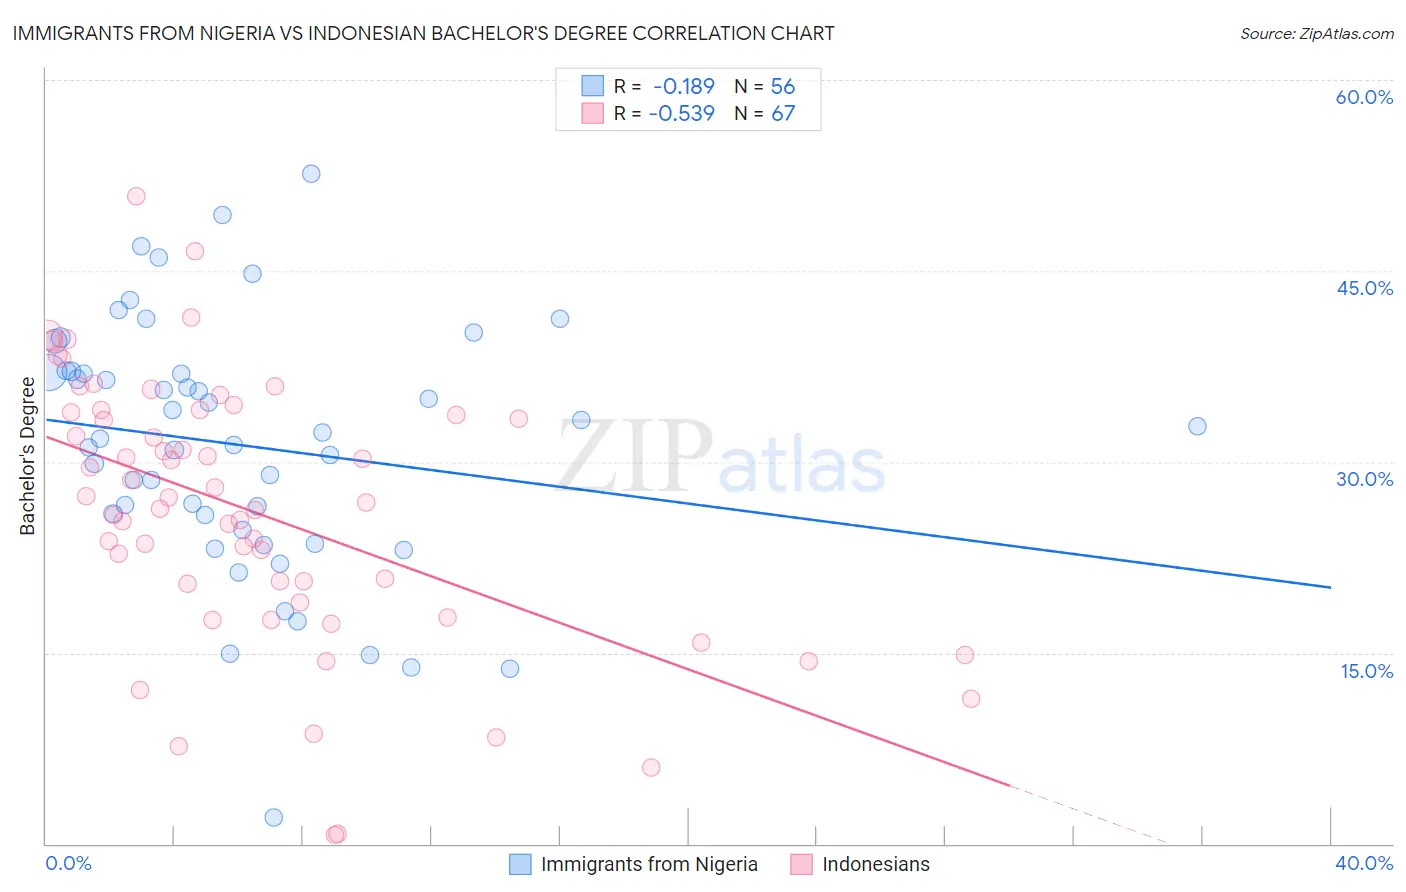
Immigrants from Nigeria vs Indonesian Bachelor's Degree Correlation Chart
The statistical analysis conducted on geographies consisting of 283,462,010 people shows a poor negative correlation between the proportion of Immigrants from Nigeria and percentage of population with at least bachelor's degree education in the United States with a correlation coefficient (R) of -0.189 and weighted average of 36.7%. Similarly, the statistical analysis conducted on geographies consisting of 162,716,505 people shows a substantial negative correlation between the proportion of Indonesians and percentage of population with at least bachelor's degree education in the United States with a correlation coefficient (R) of -0.539 and weighted average of 33.5%, a difference of 9.5%.
Bachelor's Degree Correlation Summary
| Measurement | Immigrants from Nigeria | Indonesian |
| Minimum | 2.0% | 0.73% |
| Maximum | 52.6% | 50.9% |
| Range | 50.6% | 50.2% |
| Mean | 31.3% | 26.1% |
| Median | 32.1% | 26.9% |
| Interquartile 25% (IQ1) | 25.2% | 19.0% |
| Interquartile 75% (IQ3) | 37.0% | 33.9% |
| Interquartile Range (IQR) | 11.8% | 14.9% |
| Standard Deviation (Sample) | 9.9% | 10.5% |
| Standard Deviation (Population) | 9.8% | 10.4% |
Similar Demographics by Bachelor's Degree
Demographics Similar to Immigrants from Nigeria by Bachelor's Degree
In terms of bachelor's degree, the demographic groups most similar to Immigrants from Nigeria are Immigrants (36.7%, a difference of 0.040%), Finnish (36.7%, a difference of 0.14%), Spaniard (36.6%, a difference of 0.28%), Immigrants from Zaire (36.8%, a difference of 0.29%), and Immigrants from South Eastern Asia (36.8%, a difference of 0.31%).
| Demographics | Rating | Rank | Bachelor's Degree |
| Celtics | 29.5 /100 | #196 | Fair 37.0% |
| Czechoslovakians | 29.2 /100 | #197 | Fair 37.0% |
| Welsh | 29.1 /100 | #198 | Fair 37.0% |
| Immigrants | Costa Rica | 27.4 /100 | #199 | Fair 36.9% |
| Immigrants | Ghana | 27.4 /100 | #200 | Fair 36.9% |
| Immigrants | South Eastern Asia | 25.4 /100 | #201 | Fair 36.8% |
| Immigrants | Zaire | 25.3 /100 | #202 | Fair 36.8% |
| Immigrants | Nigeria | 23.1 /100 | #203 | Fair 36.7% |
| Immigrants | Immigrants | 22.8 /100 | #204 | Fair 36.7% |
| Finns | 22.2 /100 | #205 | Fair 36.7% |
| Spaniards | 21.2 /100 | #206 | Fair 36.6% |
| Immigrants | Middle Africa | 20.6 /100 | #207 | Fair 36.6% |
| Immigrants | Thailand | 19.4 /100 | #208 | Poor 36.5% |
| Panamanians | 18.8 /100 | #209 | Poor 36.5% |
| French | 18.6 /100 | #210 | Poor 36.5% |
Demographics Similar to Indonesians by Bachelor's Degree
In terms of bachelor's degree, the demographic groups most similar to Indonesians are Immigrants from Liberia (33.5%, a difference of 0.010%), Cree (33.6%, a difference of 0.13%), Immigrants from Congo (33.6%, a difference of 0.15%), Jamaican (33.6%, a difference of 0.24%), and Immigrants from Fiji (33.7%, a difference of 0.60%).
| Demographics | Rating | Rank | Bachelor's Degree |
| Immigrants | Guyana | 1.4 /100 | #243 | Tragic 33.9% |
| Delaware | 1.2 /100 | #244 | Tragic 33.8% |
| Immigrants | Fiji | 1.2 /100 | #245 | Tragic 33.7% |
| Jamaicans | 1.0 /100 | #246 | Tragic 33.6% |
| Immigrants | Congo | 1.0 /100 | #247 | Tragic 33.6% |
| Cree | 1.0 /100 | #248 | Tragic 33.6% |
| Immigrants | Liberia | 0.9 /100 | #249 | Tragic 33.5% |
| Indonesians | 0.9 /100 | #250 | Tragic 33.5% |
| Japanese | 0.7 /100 | #251 | Tragic 33.3% |
| Immigrants | Bahamas | 0.7 /100 | #252 | Tragic 33.3% |
| U.S. Virgin Islanders | 0.7 /100 | #253 | Tragic 33.2% |
| Native Hawaiians | 0.7 /100 | #254 | Tragic 33.2% |
| Iroquois | 0.7 /100 | #255 | Tragic 33.2% |
| Nicaraguans | 0.6 /100 | #256 | Tragic 33.1% |
| Spanish Americans | 0.6 /100 | #257 | Tragic 33.1% |