Immigrants from Netherlands vs Immigrants from Sierra Leone Married-couple Households
COMPARE
Immigrants from Netherlands
Immigrants from Sierra Leone
Married-couple Households
Married-couple Households Comparison
Immigrants from Netherlands
Immigrants from Sierra Leone
48.2%
MARRIED-COUPLE HOUSEHOLDS
98.2/ 100
METRIC RATING
79th/ 347
METRIC RANK
43.3%
MARRIED-COUPLE HOUSEHOLDS
0.1/ 100
METRIC RATING
269th/ 347
METRIC RANK
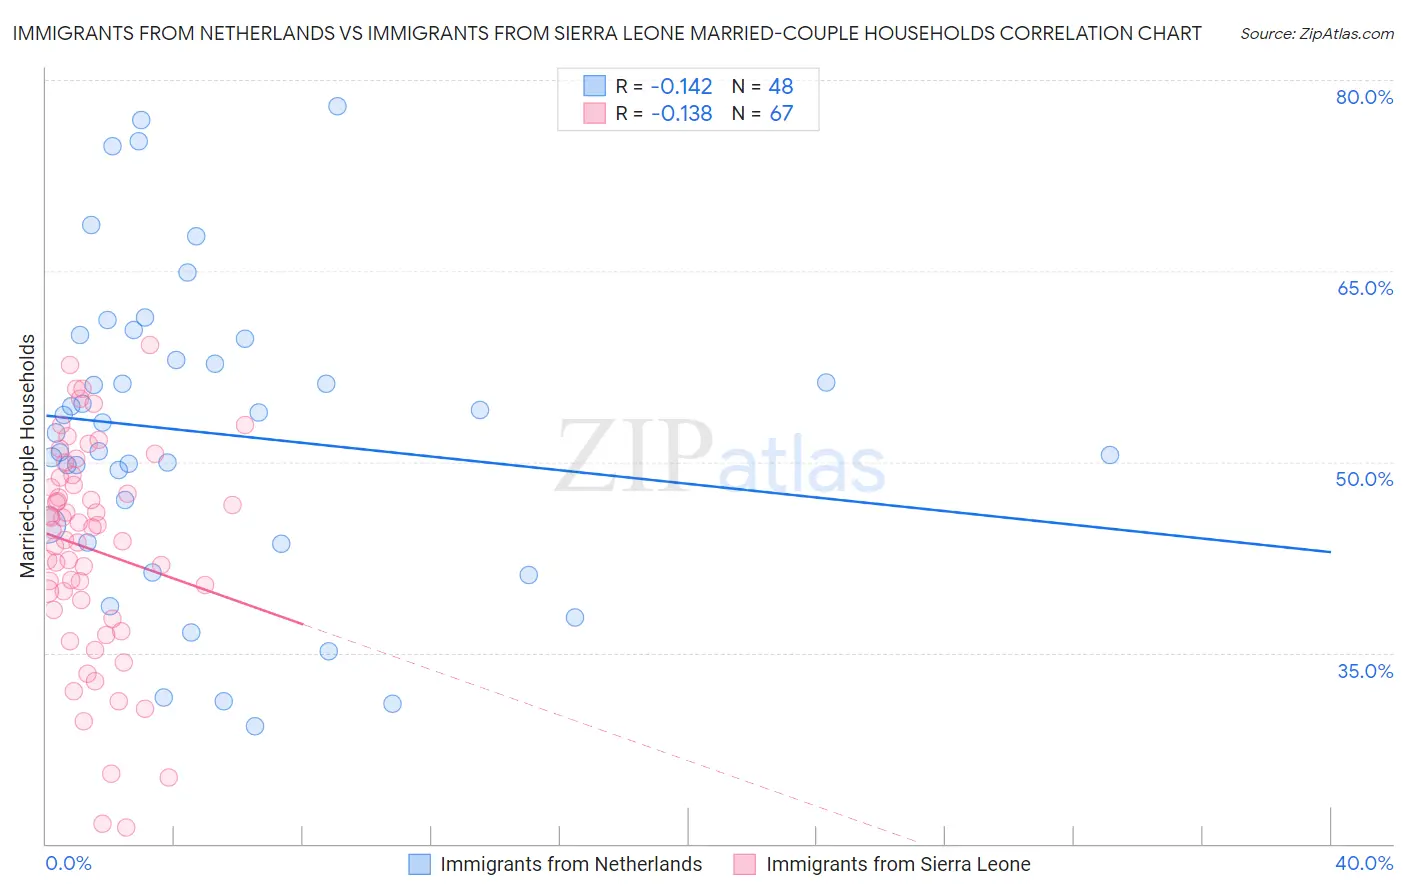
Immigrants from Netherlands vs Immigrants from Sierra Leone Married-couple Households Correlation Chart
The statistical analysis conducted on geographies consisting of 237,797,342 people shows a poor negative correlation between the proportion of Immigrants from Netherlands and percentage of married-couple family households in the United States with a correlation coefficient (R) of -0.142 and weighted average of 48.2%. Similarly, the statistical analysis conducted on geographies consisting of 101,644,825 people shows a poor negative correlation between the proportion of Immigrants from Sierra Leone and percentage of married-couple family households in the United States with a correlation coefficient (R) of -0.138 and weighted average of 43.3%, a difference of 11.2%.
Married-couple Households Correlation Summary
| Measurement | Immigrants from Netherlands | Immigrants from Sierra Leone |
| Minimum | 29.2% | 21.3% |
| Maximum | 77.9% | 59.2% |
| Range | 48.7% | 37.9% |
| Mean | 52.3% | 43.1% |
| Median | 52.7% | 44.6% |
| Interquartile 25% (IQ1) | 44.4% | 38.3% |
| Interquartile 75% (IQ3) | 58.8% | 48.8% |
| Interquartile Range (IQR) | 14.4% | 10.5% |
| Standard Deviation (Sample) | 12.0% | 8.5% |
| Standard Deviation (Population) | 11.9% | 8.4% |
Similar Demographics by Married-couple Households
Demographics Similar to Immigrants from Netherlands by Married-couple Households
In terms of married-couple households, the demographic groups most similar to Immigrants from Netherlands are Egyptian (48.2%, a difference of 0.010%), Russian (48.2%, a difference of 0.020%), Canadian (48.2%, a difference of 0.030%), Finnish (48.1%, a difference of 0.090%), and Immigrants from Fiji (48.2%, a difference of 0.12%).
| Demographics | Rating | Rank | Married-couple Households |
| Scotch-Irish | 98.6 /100 | #72 | Exceptional 48.3% |
| Immigrants | Singapore | 98.6 /100 | #73 | Exceptional 48.3% |
| Immigrants | Romania | 98.6 /100 | #74 | Exceptional 48.3% |
| Immigrants | England | 98.4 /100 | #75 | Exceptional 48.2% |
| Immigrants | Fiji | 98.4 /100 | #76 | Exceptional 48.2% |
| Canadians | 98.2 /100 | #77 | Exceptional 48.2% |
| Egyptians | 98.2 /100 | #78 | Exceptional 48.2% |
| Immigrants | Netherlands | 98.2 /100 | #79 | Exceptional 48.2% |
| Russians | 98.1 /100 | #80 | Exceptional 48.2% |
| Finns | 98.0 /100 | #81 | Exceptional 48.1% |
| Immigrants | Poland | 97.7 /100 | #82 | Exceptional 48.1% |
| Guamanians/Chamorros | 97.6 /100 | #83 | Exceptional 48.1% |
| Ukrainians | 97.6 /100 | #84 | Exceptional 48.1% |
| Immigrants | Israel | 97.4 /100 | #85 | Exceptional 48.0% |
| Belgians | 97.4 /100 | #86 | Exceptional 48.0% |
Demographics Similar to Immigrants from Sierra Leone by Married-couple Households
In terms of married-couple households, the demographic groups most similar to Immigrants from Sierra Leone are Yuman (43.3%, a difference of 0.050%), Guatemalan (43.3%, a difference of 0.15%), Immigrants from Burma/Myanmar (43.4%, a difference of 0.21%), Immigrants from Nigeria (43.2%, a difference of 0.26%), and Native/Alaskan (43.5%, a difference of 0.31%).
| Demographics | Rating | Rank | Married-couple Households |
| Vietnamese | 0.2 /100 | #262 | Tragic 43.6% |
| Cree | 0.1 /100 | #263 | Tragic 43.6% |
| Bangladeshis | 0.1 /100 | #264 | Tragic 43.5% |
| Moroccans | 0.1 /100 | #265 | Tragic 43.5% |
| Ecuadorians | 0.1 /100 | #266 | Tragic 43.5% |
| Natives/Alaskans | 0.1 /100 | #267 | Tragic 43.5% |
| Immigrants | Burma/Myanmar | 0.1 /100 | #268 | Tragic 43.4% |
| Immigrants | Sierra Leone | 0.1 /100 | #269 | Tragic 43.3% |
| Yuman | 0.1 /100 | #270 | Tragic 43.3% |
| Guatemalans | 0.1 /100 | #271 | Tragic 43.3% |
| Immigrants | Nigeria | 0.1 /100 | #272 | Tragic 43.2% |
| Ethiopians | 0.1 /100 | #273 | Tragic 43.2% |
| Nigerians | 0.1 /100 | #274 | Tragic 43.2% |
| Immigrants | Bangladesh | 0.0 /100 | #275 | Tragic 43.1% |
| Immigrants | Ethiopia | 0.0 /100 | #276 | Tragic 43.1% |