Immigrants from Netherlands vs Arab Married-couple Households
COMPARE
Immigrants from Netherlands
Arab
Married-couple Households
Married-couple Households Comparison
Immigrants from Netherlands
Arabs
48.2%
MARRIED-COUPLE HOUSEHOLDS
98.2/ 100
METRIC RATING
79th/ 347
METRIC RANK
46.9%
MARRIED-COUPLE HOUSEHOLDS
76.0/ 100
METRIC RATING
155th/ 347
METRIC RANK
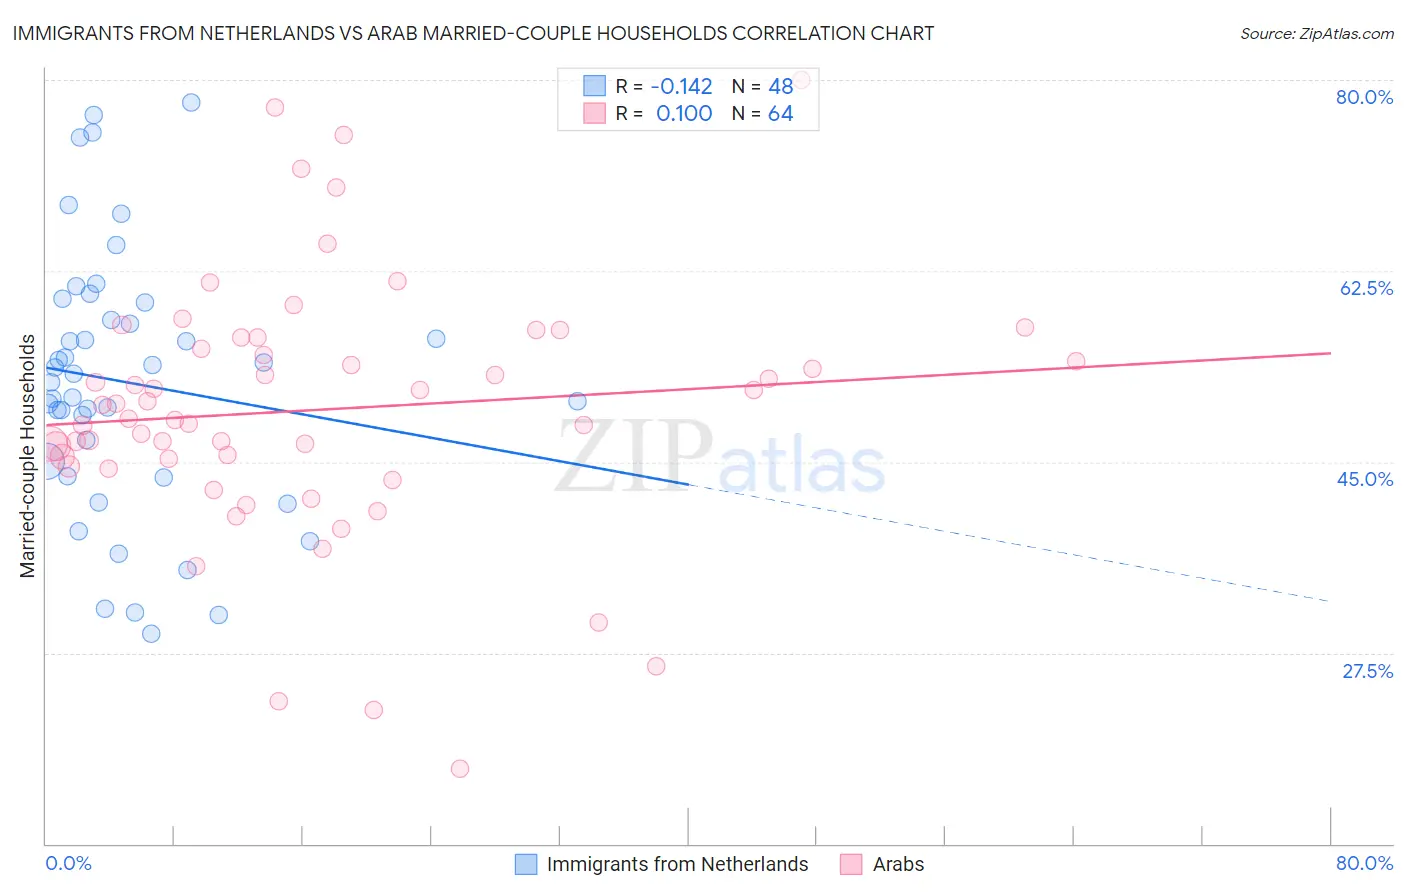
Immigrants from Netherlands vs Arab Married-couple Households Correlation Chart
The statistical analysis conducted on geographies consisting of 237,797,342 people shows a poor negative correlation between the proportion of Immigrants from Netherlands and percentage of married-couple family households in the United States with a correlation coefficient (R) of -0.142 and weighted average of 48.2%. Similarly, the statistical analysis conducted on geographies consisting of 486,357,143 people shows a slight positive correlation between the proportion of Arabs and percentage of married-couple family households in the United States with a correlation coefficient (R) of 0.100 and weighted average of 46.9%, a difference of 2.6%.
Married-couple Households Correlation Summary
| Measurement | Immigrants from Netherlands | Arab |
| Minimum | 29.2% | 16.8% |
| Maximum | 77.9% | 80.0% |
| Range | 48.7% | 63.2% |
| Mean | 52.3% | 49.8% |
| Median | 52.7% | 49.6% |
| Interquartile 25% (IQ1) | 44.4% | 45.0% |
| Interquartile 75% (IQ3) | 58.8% | 55.9% |
| Interquartile Range (IQR) | 14.4% | 11.0% |
| Standard Deviation (Sample) | 12.0% | 11.9% |
| Standard Deviation (Population) | 11.9% | 11.8% |
Similar Demographics by Married-couple Households
Demographics Similar to Immigrants from Netherlands by Married-couple Households
In terms of married-couple households, the demographic groups most similar to Immigrants from Netherlands are Egyptian (48.2%, a difference of 0.010%), Russian (48.2%, a difference of 0.020%), Canadian (48.2%, a difference of 0.030%), Finnish (48.1%, a difference of 0.090%), and Immigrants from Fiji (48.2%, a difference of 0.12%).
| Demographics | Rating | Rank | Married-couple Households |
| Scotch-Irish | 98.6 /100 | #72 | Exceptional 48.3% |
| Immigrants | Singapore | 98.6 /100 | #73 | Exceptional 48.3% |
| Immigrants | Romania | 98.6 /100 | #74 | Exceptional 48.3% |
| Immigrants | England | 98.4 /100 | #75 | Exceptional 48.2% |
| Immigrants | Fiji | 98.4 /100 | #76 | Exceptional 48.2% |
| Canadians | 98.2 /100 | #77 | Exceptional 48.2% |
| Egyptians | 98.2 /100 | #78 | Exceptional 48.2% |
| Immigrants | Netherlands | 98.2 /100 | #79 | Exceptional 48.2% |
| Russians | 98.1 /100 | #80 | Exceptional 48.2% |
| Finns | 98.0 /100 | #81 | Exceptional 48.1% |
| Immigrants | Poland | 97.7 /100 | #82 | Exceptional 48.1% |
| Guamanians/Chamorros | 97.6 /100 | #83 | Exceptional 48.1% |
| Ukrainians | 97.6 /100 | #84 | Exceptional 48.1% |
| Immigrants | Israel | 97.4 /100 | #85 | Exceptional 48.0% |
| Belgians | 97.4 /100 | #86 | Exceptional 48.0% |
Demographics Similar to Arabs by Married-couple Households
In terms of married-couple households, the demographic groups most similar to Arabs are Hmong (47.0%, a difference of 0.010%), Immigrants from Western Asia (46.9%, a difference of 0.010%), Serbian (47.0%, a difference of 0.020%), Armenian (46.9%, a difference of 0.030%), and Immigrants from Bulgaria (47.0%, a difference of 0.040%).
| Demographics | Rating | Rank | Married-couple Households |
| Icelanders | 79.5 /100 | #148 | Good 47.0% |
| Paraguayans | 78.7 /100 | #149 | Good 47.0% |
| Immigrants | Russia | 77.6 /100 | #150 | Good 47.0% |
| Immigrants | Bulgaria | 76.8 /100 | #151 | Good 47.0% |
| Serbians | 76.3 /100 | #152 | Good 47.0% |
| Hmong | 76.2 /100 | #153 | Good 47.0% |
| Immigrants | Western Asia | 76.1 /100 | #154 | Good 46.9% |
| Arabs | 76.0 /100 | #155 | Good 46.9% |
| Armenians | 75.4 /100 | #156 | Good 46.9% |
| Immigrants | Oceania | 74.8 /100 | #157 | Good 46.9% |
| Immigrants | Nonimmigrants | 73.3 /100 | #158 | Good 46.9% |
| Osage | 73.2 /100 | #159 | Good 46.9% |
| Iraqis | 71.7 /100 | #160 | Good 46.9% |
| Delaware | 71.2 /100 | #161 | Good 46.8% |
| Colombians | 71.0 /100 | #162 | Good 46.8% |