Immigrants from South Africa vs Immigrants from Sierra Leone Married-couple Households
COMPARE
Immigrants from South Africa
Immigrants from Sierra Leone
Married-couple Households
Married-couple Households Comparison
Immigrants from South Africa
Immigrants from Sierra Leone
47.8%
MARRIED-COUPLE HOUSEHOLDS
96.0/ 100
METRIC RATING
104th/ 347
METRIC RANK
43.3%
MARRIED-COUPLE HOUSEHOLDS
0.1/ 100
METRIC RATING
269th/ 347
METRIC RANK
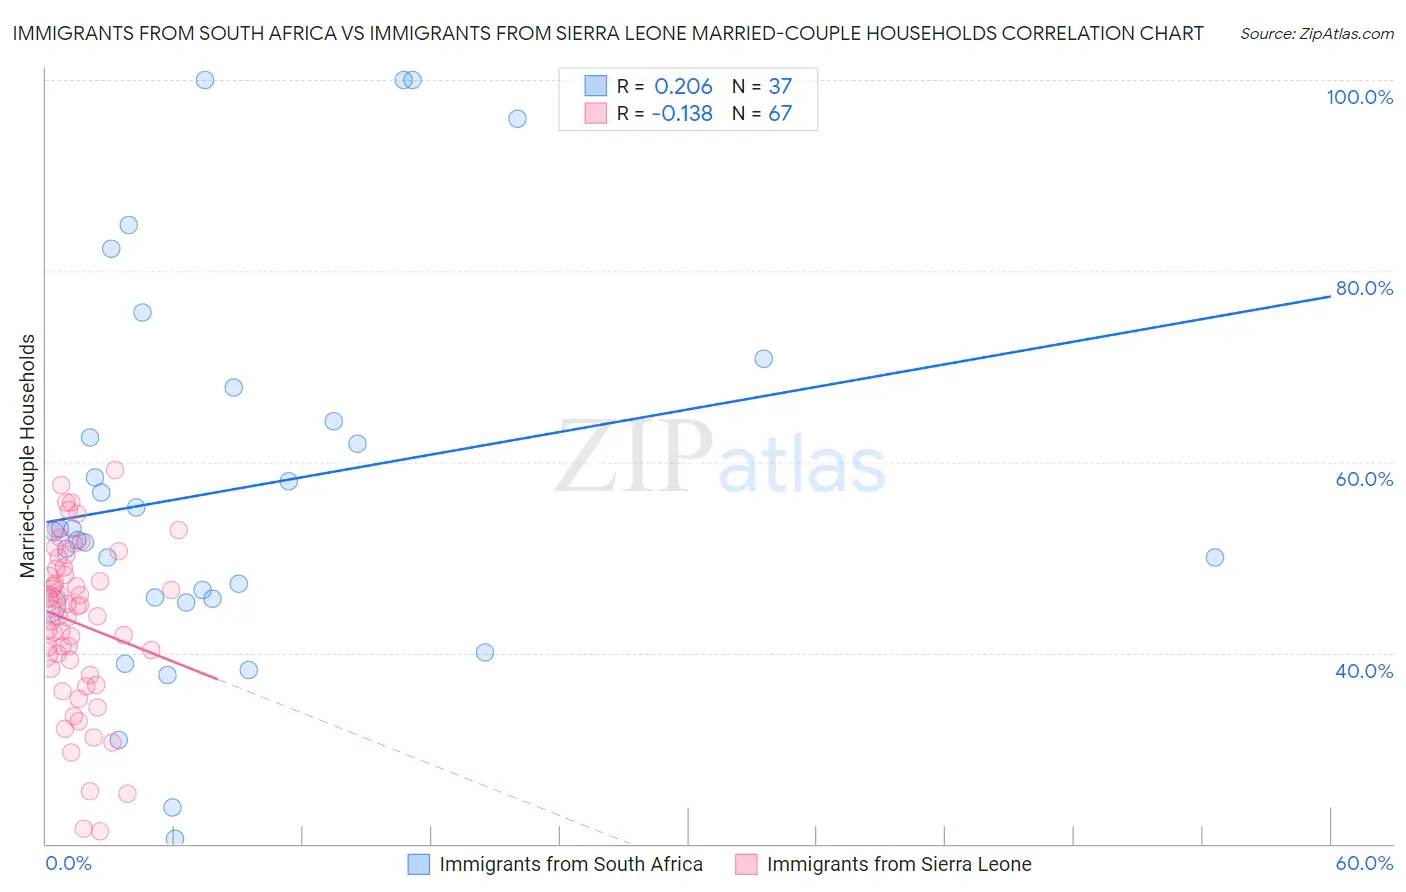
Immigrants from South Africa vs Immigrants from Sierra Leone Married-couple Households Correlation Chart
The statistical analysis conducted on geographies consisting of 233,270,946 people shows a weak positive correlation between the proportion of Immigrants from South Africa and percentage of married-couple family households in the United States with a correlation coefficient (R) of 0.206 and weighted average of 47.8%. Similarly, the statistical analysis conducted on geographies consisting of 101,644,825 people shows a poor negative correlation between the proportion of Immigrants from Sierra Leone and percentage of married-couple family households in the United States with a correlation coefficient (R) of -0.138 and weighted average of 43.3%, a difference of 10.4%.
Married-couple Households Correlation Summary
| Measurement | Immigrants from South Africa | Immigrants from Sierra Leone |
| Minimum | 20.5% | 21.3% |
| Maximum | 100.0% | 59.2% |
| Range | 79.5% | 37.9% |
| Mean | 57.1% | 43.1% |
| Median | 52.7% | 44.6% |
| Interquartile 25% (IQ1) | 45.5% | 38.3% |
| Interquartile 75% (IQ3) | 66.0% | 48.8% |
| Interquartile Range (IQR) | 20.6% | 10.5% |
| Standard Deviation (Sample) | 20.2% | 8.5% |
| Standard Deviation (Population) | 19.9% | 8.4% |
Similar Demographics by Married-couple Households
Demographics Similar to Immigrants from South Africa by Married-couple Households
In terms of married-couple households, the demographic groups most similar to Immigrants from South Africa are Slavic (47.8%, a difference of 0.010%), Hawaiian (47.8%, a difference of 0.010%), Turkish (47.8%, a difference of 0.030%), Immigrants from Italy (47.9%, a difference of 0.090%), and Immigrants from Austria (47.9%, a difference of 0.10%).
| Demographics | Rating | Rank | Married-couple Households |
| Latvians | 96.5 /100 | #97 | Exceptional 47.9% |
| Immigrants | North Macedonia | 96.4 /100 | #98 | Exceptional 47.9% |
| Immigrants | Austria | 96.4 /100 | #99 | Exceptional 47.9% |
| Immigrants | Italy | 96.3 /100 | #100 | Exceptional 47.9% |
| Turks | 96.1 /100 | #101 | Exceptional 47.8% |
| Slavs | 96.0 /100 | #102 | Exceptional 47.8% |
| Hawaiians | 96.0 /100 | #103 | Exceptional 47.8% |
| Immigrants | South Africa | 96.0 /100 | #104 | Exceptional 47.8% |
| Immigrants | Czechoslovakia | 95.5 /100 | #105 | Exceptional 47.8% |
| Portuguese | 95.5 /100 | #106 | Exceptional 47.8% |
| Estonians | 94.7 /100 | #107 | Exceptional 47.7% |
| Immigrants | Japan | 94.4 /100 | #108 | Exceptional 47.7% |
| Immigrants | Jordan | 94.1 /100 | #109 | Exceptional 47.7% |
| Macedonians | 93.9 /100 | #110 | Exceptional 47.6% |
| Syrians | 93.9 /100 | #111 | Exceptional 47.6% |
Demographics Similar to Immigrants from Sierra Leone by Married-couple Households
In terms of married-couple households, the demographic groups most similar to Immigrants from Sierra Leone are Yuman (43.3%, a difference of 0.050%), Guatemalan (43.3%, a difference of 0.15%), Immigrants from Burma/Myanmar (43.4%, a difference of 0.21%), Immigrants from Nigeria (43.2%, a difference of 0.26%), and Native/Alaskan (43.5%, a difference of 0.31%).
| Demographics | Rating | Rank | Married-couple Households |
| Vietnamese | 0.2 /100 | #262 | Tragic 43.6% |
| Cree | 0.1 /100 | #263 | Tragic 43.6% |
| Bangladeshis | 0.1 /100 | #264 | Tragic 43.5% |
| Moroccans | 0.1 /100 | #265 | Tragic 43.5% |
| Ecuadorians | 0.1 /100 | #266 | Tragic 43.5% |
| Natives/Alaskans | 0.1 /100 | #267 | Tragic 43.5% |
| Immigrants | Burma/Myanmar | 0.1 /100 | #268 | Tragic 43.4% |
| Immigrants | Sierra Leone | 0.1 /100 | #269 | Tragic 43.3% |
| Yuman | 0.1 /100 | #270 | Tragic 43.3% |
| Guatemalans | 0.1 /100 | #271 | Tragic 43.3% |
| Immigrants | Nigeria | 0.1 /100 | #272 | Tragic 43.2% |
| Ethiopians | 0.1 /100 | #273 | Tragic 43.2% |
| Nigerians | 0.1 /100 | #274 | Tragic 43.2% |
| Immigrants | Bangladesh | 0.0 /100 | #275 | Tragic 43.1% |
| Immigrants | Ethiopia | 0.0 /100 | #276 | Tragic 43.1% |