Immigrants from Netherlands vs Czechoslovakian Married-couple Households
COMPARE
Immigrants from Netherlands
Czechoslovakian
Married-couple Households
Married-couple Households Comparison
Immigrants from Netherlands
Czechoslovakians
48.2%
MARRIED-COUPLE HOUSEHOLDS
98.2/ 100
METRIC RATING
79th/ 347
METRIC RANK
48.5%
MARRIED-COUPLE HOUSEHOLDS
99.2/ 100
METRIC RATING
59th/ 347
METRIC RANK
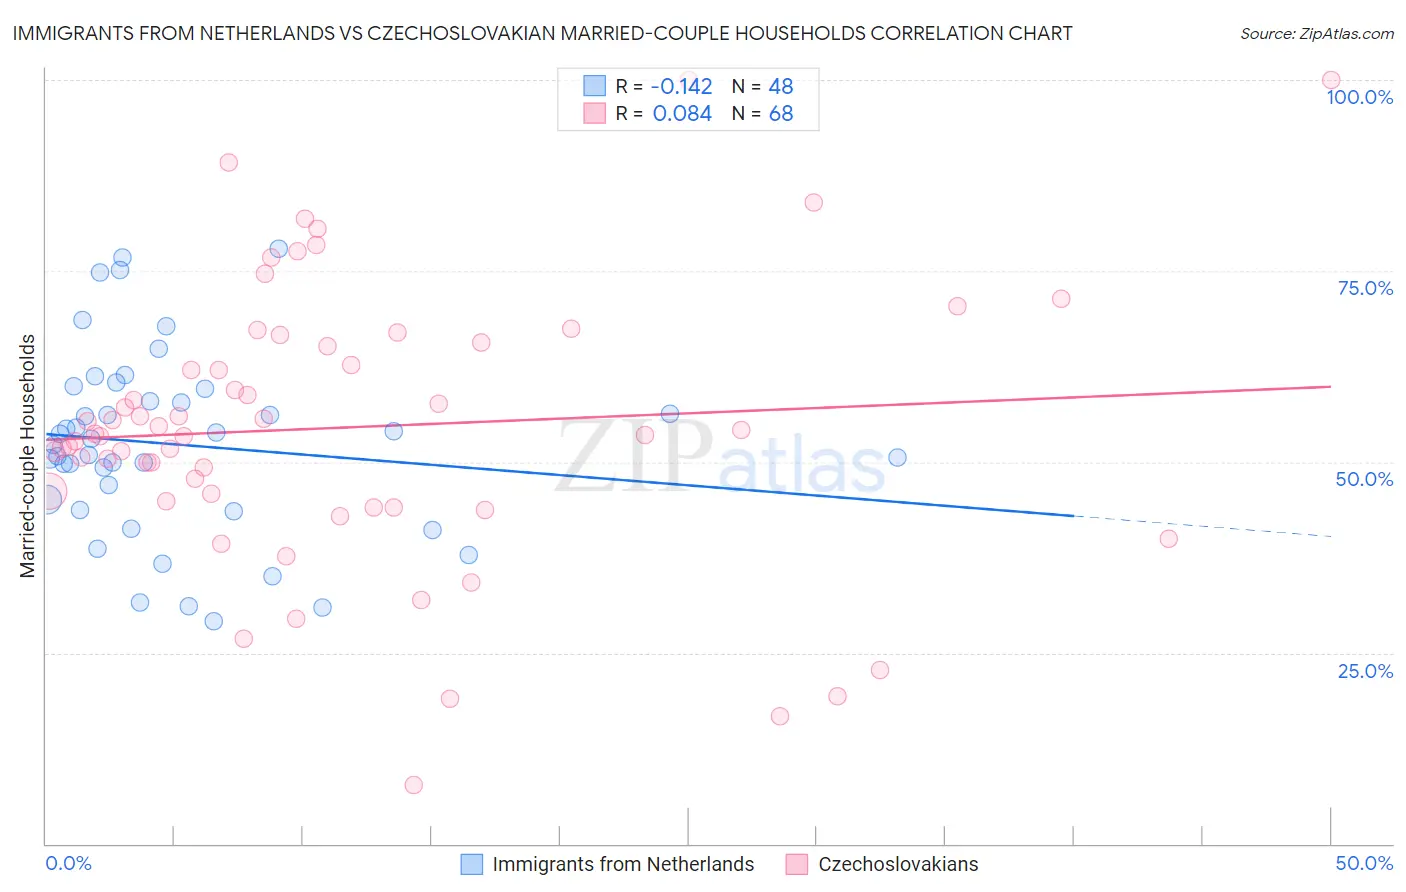
Immigrants from Netherlands vs Czechoslovakian Married-couple Households Correlation Chart
The statistical analysis conducted on geographies consisting of 237,797,342 people shows a poor negative correlation between the proportion of Immigrants from Netherlands and percentage of married-couple family households in the United States with a correlation coefficient (R) of -0.142 and weighted average of 48.2%. Similarly, the statistical analysis conducted on geographies consisting of 368,521,204 people shows a slight positive correlation between the proportion of Czechoslovakians and percentage of married-couple family households in the United States with a correlation coefficient (R) of 0.084 and weighted average of 48.5%, a difference of 0.75%.
Married-couple Households Correlation Summary
| Measurement | Immigrants from Netherlands | Czechoslovakian |
| Minimum | 29.2% | 7.6% |
| Maximum | 77.9% | 100.0% |
| Range | 48.7% | 92.4% |
| Mean | 52.3% | 54.5% |
| Median | 52.7% | 53.6% |
| Interquartile 25% (IQ1) | 44.4% | 45.3% |
| Interquartile 75% (IQ3) | 58.8% | 65.4% |
| Interquartile Range (IQR) | 14.4% | 20.1% |
| Standard Deviation (Sample) | 12.0% | 18.3% |
| Standard Deviation (Population) | 11.9% | 18.1% |
Demographics Similar to Immigrants from Netherlands and Czechoslovakians by Married-couple Households
In terms of married-couple households, the demographic groups most similar to Immigrants from Netherlands are Egyptian (48.2%, a difference of 0.010%), Canadian (48.2%, a difference of 0.030%), Immigrants from Fiji (48.2%, a difference of 0.12%), Immigrants from England (48.2%, a difference of 0.13%), and Immigrants from Romania (48.3%, a difference of 0.21%). Similarly, the demographic groups most similar to Czechoslovakians are Croatian (48.5%, a difference of 0.080%), Bulgarian (48.5%, a difference of 0.13%), Luxembourger (48.5%, a difference of 0.14%), Basque (48.4%, a difference of 0.20%), and Northern European (48.4%, a difference of 0.21%).
| Demographics | Rating | Rank | Married-couple Households |
| Czechoslovakians | 99.2 /100 | #59 | Exceptional 48.5% |
| Croatians | 99.1 /100 | #60 | Exceptional 48.5% |
| Bulgarians | 99.1 /100 | #61 | Exceptional 48.5% |
| Luxembourgers | 99.1 /100 | #62 | Exceptional 48.5% |
| Basques | 99.0 /100 | #63 | Exceptional 48.4% |
| Northern Europeans | 99.0 /100 | #64 | Exceptional 48.4% |
| Immigrants | Canada | 99.0 /100 | #65 | Exceptional 48.4% |
| Jordanians | 98.9 /100 | #66 | Exceptional 48.4% |
| Romanians | 98.9 /100 | #67 | Exceptional 48.4% |
| Immigrants | South Eastern Asia | 98.9 /100 | #68 | Exceptional 48.4% |
| Immigrants | China | 98.9 /100 | #69 | Exceptional 48.4% |
| Immigrants | North America | 98.9 /100 | #70 | Exceptional 48.4% |
| Laotians | 98.8 /100 | #71 | Exceptional 48.4% |
| Scotch-Irish | 98.6 /100 | #72 | Exceptional 48.3% |
| Immigrants | Singapore | 98.6 /100 | #73 | Exceptional 48.3% |
| Immigrants | Romania | 98.6 /100 | #74 | Exceptional 48.3% |
| Immigrants | England | 98.4 /100 | #75 | Exceptional 48.2% |
| Immigrants | Fiji | 98.4 /100 | #76 | Exceptional 48.2% |
| Canadians | 98.2 /100 | #77 | Exceptional 48.2% |
| Egyptians | 98.2 /100 | #78 | Exceptional 48.2% |
| Immigrants | Netherlands | 98.2 /100 | #79 | Exceptional 48.2% |