Central American Indian vs Czechoslovakian Married-couple Households
COMPARE
Central American Indian
Czechoslovakian
Married-couple Households
Married-couple Households Comparison
Central American Indians
Czechoslovakians
43.8%
MARRIED-COUPLE HOUSEHOLDS
0.2/ 100
METRIC RATING
258th/ 347
METRIC RANK
48.5%
MARRIED-COUPLE HOUSEHOLDS
99.2/ 100
METRIC RATING
59th/ 347
METRIC RANK
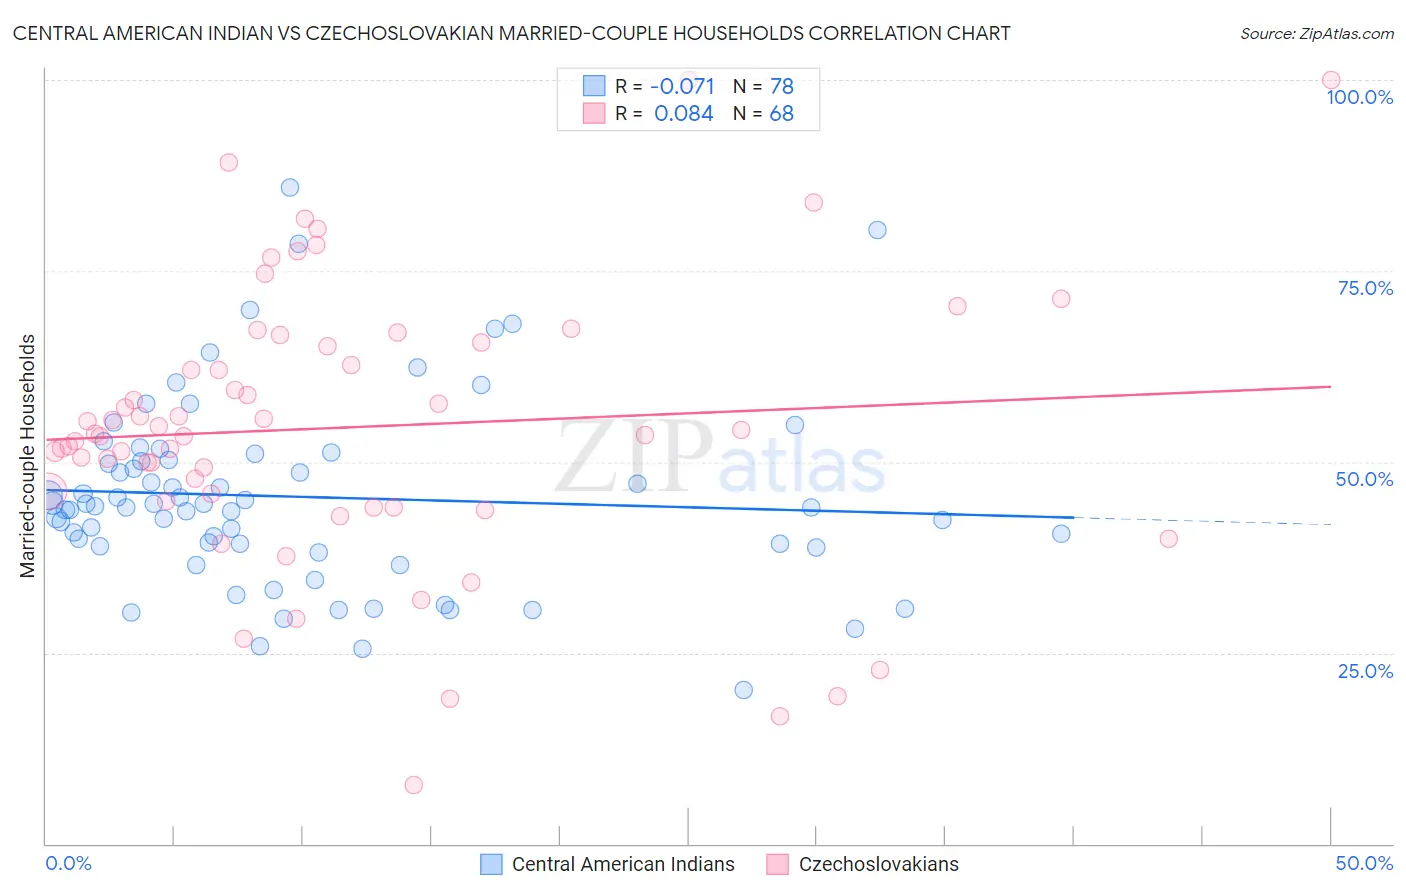
Central American Indian vs Czechoslovakian Married-couple Households Correlation Chart
The statistical analysis conducted on geographies consisting of 326,060,937 people shows a slight negative correlation between the proportion of Central American Indians and percentage of married-couple family households in the United States with a correlation coefficient (R) of -0.071 and weighted average of 43.8%. Similarly, the statistical analysis conducted on geographies consisting of 368,521,204 people shows a slight positive correlation between the proportion of Czechoslovakians and percentage of married-couple family households in the United States with a correlation coefficient (R) of 0.084 and weighted average of 48.5%, a difference of 10.9%.
Married-couple Households Correlation Summary
| Measurement | Central American Indian | Czechoslovakian |
| Minimum | 20.1% | 7.6% |
| Maximum | 86.0% | 100.0% |
| Range | 65.9% | 92.4% |
| Mean | 45.4% | 54.5% |
| Median | 44.1% | 53.6% |
| Interquartile 25% (IQ1) | 39.0% | 45.3% |
| Interquartile 75% (IQ3) | 50.2% | 65.4% |
| Interquartile Range (IQR) | 11.3% | 20.1% |
| Standard Deviation (Sample) | 12.5% | 18.3% |
| Standard Deviation (Population) | 12.4% | 18.1% |
Similar Demographics by Married-couple Households
Demographics Similar to Central American Indians by Married-couple Households
In terms of married-couple households, the demographic groups most similar to Central American Indians are Iroquois (43.7%, a difference of 0.030%), Blackfeet (43.8%, a difference of 0.040%), Immigrants from Cameroon (43.7%, a difference of 0.12%), Ugandan (43.8%, a difference of 0.20%), and Alaskan Athabascan (43.6%, a difference of 0.25%).
| Demographics | Rating | Rank | Married-couple Households |
| German Russians | 0.4 /100 | #251 | Tragic 44.0% |
| Seminole | 0.4 /100 | #252 | Tragic 44.0% |
| Central Americans | 0.3 /100 | #253 | Tragic 43.9% |
| Apache | 0.3 /100 | #254 | Tragic 43.9% |
| Shoshone | 0.3 /100 | #255 | Tragic 43.9% |
| Ugandans | 0.3 /100 | #256 | Tragic 43.8% |
| Blackfeet | 0.2 /100 | #257 | Tragic 43.8% |
| Central American Indians | 0.2 /100 | #258 | Tragic 43.8% |
| Iroquois | 0.2 /100 | #259 | Tragic 43.7% |
| Immigrants | Cameroon | 0.2 /100 | #260 | Tragic 43.7% |
| Alaskan Athabascans | 0.2 /100 | #261 | Tragic 43.6% |
| Vietnamese | 0.2 /100 | #262 | Tragic 43.6% |
| Cree | 0.1 /100 | #263 | Tragic 43.6% |
| Bangladeshis | 0.1 /100 | #264 | Tragic 43.5% |
| Moroccans | 0.1 /100 | #265 | Tragic 43.5% |
Demographics Similar to Czechoslovakians by Married-couple Households
In terms of married-couple households, the demographic groups most similar to Czechoslovakians are Immigrants from Indonesia (48.5%, a difference of 0.0%), Polish (48.5%, a difference of 0.010%), Croatian (48.5%, a difference of 0.080%), Austrian (48.6%, a difference of 0.090%), and Immigrants from Northern Europe (48.6%, a difference of 0.090%).
| Demographics | Rating | Rank | Married-couple Households |
| Irish | 99.3 /100 | #52 | Exceptional 48.6% |
| Whites/Caucasians | 99.3 /100 | #53 | Exceptional 48.6% |
| Immigrants | Lithuania | 99.3 /100 | #54 | Exceptional 48.6% |
| Austrians | 99.3 /100 | #55 | Exceptional 48.6% |
| Immigrants | Northern Europe | 99.3 /100 | #56 | Exceptional 48.6% |
| Poles | 99.2 /100 | #57 | Exceptional 48.5% |
| Immigrants | Indonesia | 99.2 /100 | #58 | Exceptional 48.5% |
| Czechoslovakians | 99.2 /100 | #59 | Exceptional 48.5% |
| Croatians | 99.1 /100 | #60 | Exceptional 48.5% |
| Bulgarians | 99.1 /100 | #61 | Exceptional 48.5% |
| Luxembourgers | 99.1 /100 | #62 | Exceptional 48.5% |
| Basques | 99.0 /100 | #63 | Exceptional 48.4% |
| Northern Europeans | 99.0 /100 | #64 | Exceptional 48.4% |
| Immigrants | Canada | 99.0 /100 | #65 | Exceptional 48.4% |
| Jordanians | 98.9 /100 | #66 | Exceptional 48.4% |