Immigrants from Netherlands vs Czechoslovakian Currently Married
COMPARE
Immigrants from Netherlands
Czechoslovakian
Currently Married
Currently Married Comparison
Immigrants from Netherlands
Czechoslovakians
48.5%
CURRENTLY MARRIED
98.6/ 100
METRIC RATING
57th/ 347
METRIC RANK
48.8%
CURRENTLY MARRIED
99.4/ 100
METRIC RATING
38th/ 347
METRIC RANK
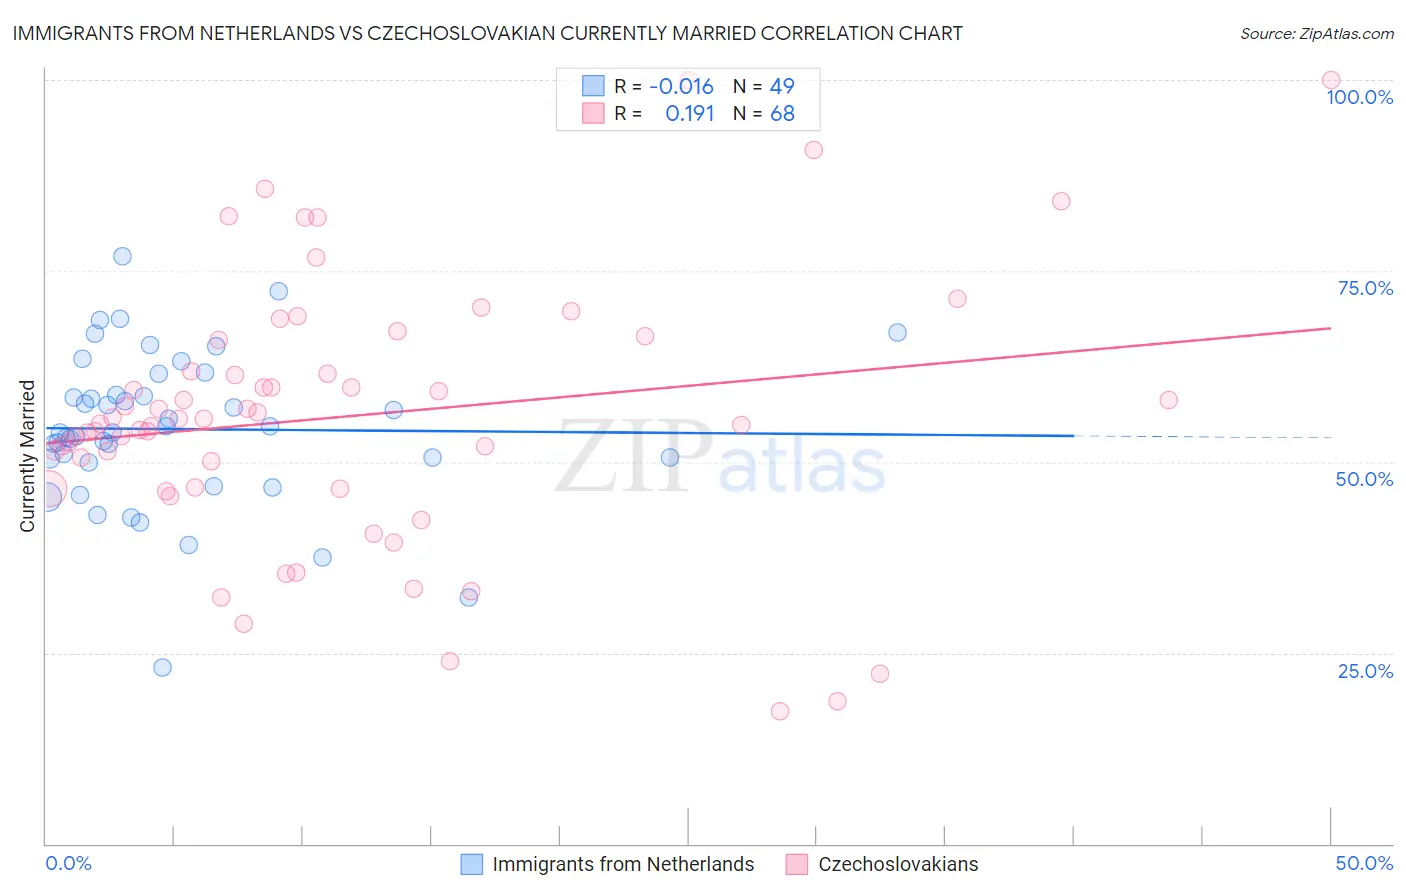
Immigrants from Netherlands vs Czechoslovakian Currently Married Correlation Chart
The statistical analysis conducted on geographies consisting of 237,864,062 people shows no correlation between the proportion of Immigrants from Netherlands and percentage of population currently married in the United States with a correlation coefficient (R) of -0.016 and weighted average of 48.5%. Similarly, the statistical analysis conducted on geographies consisting of 368,635,685 people shows a poor positive correlation between the proportion of Czechoslovakians and percentage of population currently married in the United States with a correlation coefficient (R) of 0.191 and weighted average of 48.8%, a difference of 0.73%.
Currently Married Correlation Summary
| Measurement | Immigrants from Netherlands | Czechoslovakian |
| Minimum | 23.1% | 17.3% |
| Maximum | 76.9% | 100.0% |
| Range | 53.8% | 82.7% |
| Mean | 54.3% | 56.0% |
| Median | 53.9% | 55.3% |
| Interquartile 25% (IQ1) | 50.2% | 46.6% |
| Interquartile 75% (IQ3) | 60.2% | 63.9% |
| Interquartile Range (IQR) | 10.0% | 17.3% |
| Standard Deviation (Sample) | 10.1% | 17.4% |
| Standard Deviation (Population) | 10.0% | 17.3% |
Demographics Similar to Immigrants from Netherlands and Czechoslovakians by Currently Married
In terms of currently married, the demographic groups most similar to Immigrants from Netherlands are Immigrants from Moldova (48.5%, a difference of 0.030%), Immigrants from North Macedonia (48.5%, a difference of 0.030%), Latvian (48.5%, a difference of 0.030%), Immigrants from Austria (48.5%, a difference of 0.10%), and Russian (48.6%, a difference of 0.21%). Similarly, the demographic groups most similar to Czechoslovakians are British (48.8%, a difference of 0.030%), Hungarian (48.8%, a difference of 0.040%), Immigrants from Canada (48.8%, a difference of 0.050%), Greek (48.8%, a difference of 0.070%), and Finnish (48.8%, a difference of 0.12%).
| Demographics | Rating | Rank | Currently Married |
| Hungarians | 99.4 /100 | #37 | Exceptional 48.8% |
| Czechoslovakians | 99.4 /100 | #38 | Exceptional 48.8% |
| British | 99.4 /100 | #39 | Exceptional 48.8% |
| Immigrants | Canada | 99.4 /100 | #40 | Exceptional 48.8% |
| Greeks | 99.3 /100 | #41 | Exceptional 48.8% |
| Finns | 99.3 /100 | #42 | Exceptional 48.8% |
| Scotch-Irish | 99.3 /100 | #43 | Exceptional 48.7% |
| Immigrants | North America | 99.3 /100 | #44 | Exceptional 48.7% |
| Belgians | 99.3 /100 | #45 | Exceptional 48.7% |
| Immigrants | Iran | 99.2 /100 | #46 | Exceptional 48.7% |
| Northern Europeans | 99.2 /100 | #47 | Exceptional 48.7% |
| Austrians | 99.2 /100 | #48 | Exceptional 48.7% |
| Bhutanese | 99.1 /100 | #49 | Exceptional 48.6% |
| Iranians | 99.0 /100 | #50 | Exceptional 48.6% |
| Whites/Caucasians | 99.0 /100 | #51 | Exceptional 48.6% |
| Russians | 98.9 /100 | #52 | Exceptional 48.6% |
| Immigrants | Austria | 98.8 /100 | #53 | Exceptional 48.5% |
| Immigrants | Moldova | 98.7 /100 | #54 | Exceptional 48.5% |
| Immigrants | North Macedonia | 98.7 /100 | #55 | Exceptional 48.5% |
| Latvians | 98.7 /100 | #56 | Exceptional 48.5% |
| Immigrants | Netherlands | 98.6 /100 | #57 | Exceptional 48.5% |