Immigrants from Morocco vs Immigrants from Fiji Kindergarten
COMPARE
Immigrants from Morocco
Immigrants from Fiji
Kindergarten
Kindergarten Comparison
Immigrants from Morocco
Immigrants from Fiji
97.7%
KINDERGARTEN
5.4/ 100
METRIC RATING
218th/ 347
METRIC RANK
96.5%
KINDERGARTEN
0.0/ 100
METRIC RATING
338th/ 347
METRIC RANK
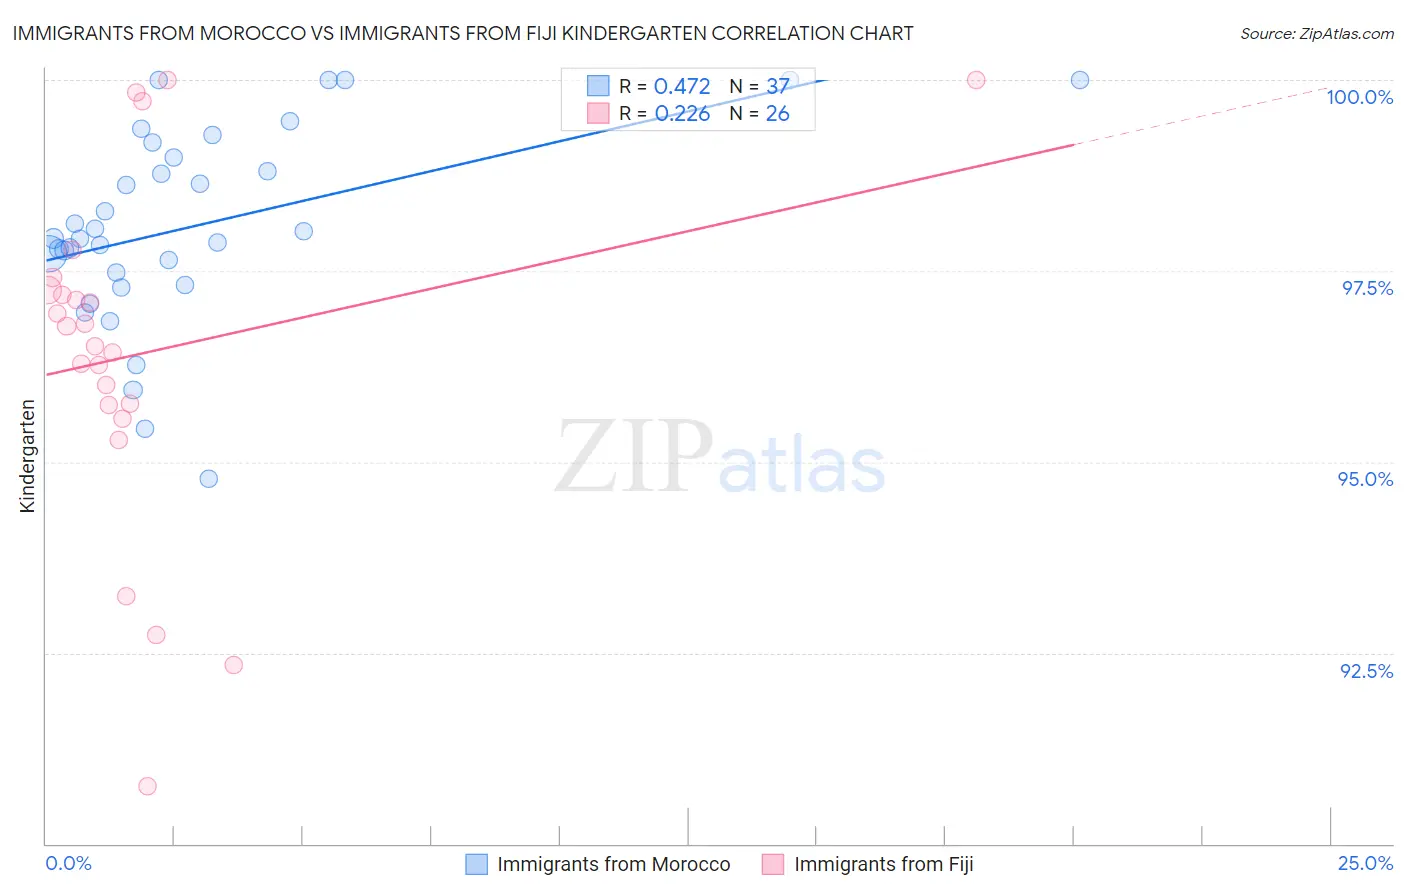
Immigrants from Morocco vs Immigrants from Fiji Kindergarten Correlation Chart
The statistical analysis conducted on geographies consisting of 178,912,438 people shows a moderate positive correlation between the proportion of Immigrants from Morocco and percentage of population with at least kindergarten education in the United States with a correlation coefficient (R) of 0.472 and weighted average of 97.7%. Similarly, the statistical analysis conducted on geographies consisting of 93,756,204 people shows a weak positive correlation between the proportion of Immigrants from Fiji and percentage of population with at least kindergarten education in the United States with a correlation coefficient (R) of 0.226 and weighted average of 96.5%, a difference of 1.3%.
Kindergarten Correlation Summary
| Measurement | Immigrants from Morocco | Immigrants from Fiji |
| Minimum | 94.8% | 90.8% |
| Maximum | 100.0% | 100.0% |
| Range | 5.2% | 9.2% |
| Mean | 98.1% | 96.4% |
| Median | 97.9% | 96.6% |
| Interquartile 25% (IQ1) | 97.4% | 95.7% |
| Interquartile 75% (IQ3) | 99.1% | 97.2% |
| Interquartile Range (IQR) | 1.7% | 1.5% |
| Standard Deviation (Sample) | 1.3% | 2.3% |
| Standard Deviation (Population) | 1.3% | 2.2% |
Similar Demographics by Kindergarten
Demographics Similar to Immigrants from Morocco by Kindergarten
In terms of kindergarten, the demographic groups most similar to Immigrants from Morocco are Immigrants from Panama (97.7%, a difference of 0.010%), Tongan (97.7%, a difference of 0.010%), Immigrants from Bahamas (97.8%, a difference of 0.020%), Samoan (97.8%, a difference of 0.020%), and Bahamian (97.8%, a difference of 0.020%).
| Demographics | Rating | Rank | Kindergarten |
| Laotians | 10.5 /100 | #211 | Poor 97.8% |
| Moroccans | 8.9 /100 | #212 | Tragic 97.8% |
| South American Indians | 7.7 /100 | #213 | Tragic 97.8% |
| Uruguayans | 7.5 /100 | #214 | Tragic 97.8% |
| Immigrants | Bahamas | 7.4 /100 | #215 | Tragic 97.8% |
| Samoans | 6.9 /100 | #216 | Tragic 97.8% |
| Bahamians | 6.6 /100 | #217 | Tragic 97.8% |
| Immigrants | Morocco | 5.4 /100 | #218 | Tragic 97.7% |
| Immigrants | Panama | 5.0 /100 | #219 | Tragic 97.7% |
| Tongans | 4.8 /100 | #220 | Tragic 97.7% |
| Immigrants | Zaire | 4.5 /100 | #221 | Tragic 97.7% |
| Immigrants | Sudan | 4.5 /100 | #222 | Tragic 97.7% |
| Immigrants | Syria | 4.3 /100 | #223 | Tragic 97.7% |
| Iraqis | 3.9 /100 | #224 | Tragic 97.7% |
| Immigrants | Nepal | 3.8 /100 | #225 | Tragic 97.7% |
Demographics Similar to Immigrants from Fiji by Kindergarten
In terms of kindergarten, the demographic groups most similar to Immigrants from Fiji are Immigrants from Cambodia (96.5%, a difference of 0.010%), Guatemalan (96.5%, a difference of 0.050%), Immigrants from Dominican Republic (96.6%, a difference of 0.080%), Bangladeshi (96.6%, a difference of 0.080%), and Immigrants from Guatemala (96.4%, a difference of 0.080%).
| Demographics | Rating | Rank | Kindergarten |
| Immigrants | Armenia | 0.0 /100 | #331 | Tragic 96.6% |
| Yakama | 0.0 /100 | #332 | Tragic 96.6% |
| Central Americans | 0.0 /100 | #333 | Tragic 96.6% |
| Immigrants | Dominican Republic | 0.0 /100 | #334 | Tragic 96.6% |
| Bangladeshis | 0.0 /100 | #335 | Tragic 96.6% |
| Guatemalans | 0.0 /100 | #336 | Tragic 96.5% |
| Immigrants | Cambodia | 0.0 /100 | #337 | Tragic 96.5% |
| Immigrants | Fiji | 0.0 /100 | #338 | Tragic 96.5% |
| Immigrants | Guatemala | 0.0 /100 | #339 | Tragic 96.4% |
| Immigrants | Central America | 0.0 /100 | #340 | Tragic 96.4% |
| Immigrants | Cabo Verde | 0.0 /100 | #341 | Tragic 96.4% |
| Immigrants | Mexico | 0.0 /100 | #342 | Tragic 96.4% |
| Salvadorans | 0.0 /100 | #343 | Tragic 96.3% |
| Nepalese | 0.0 /100 | #344 | Tragic 96.2% |
| Immigrants | El Salvador | 0.0 /100 | #345 | Tragic 96.2% |