Immigrants from Latvia vs Scottish Married-couple Households
COMPARE
Immigrants from Latvia
Scottish
Married-couple Households
Married-couple Households Comparison
Immigrants from Latvia
Scottish
46.0%
MARRIED-COUPLE HOUSEHOLDS
26.9/ 100
METRIC RATING
189th/ 347
METRIC RANK
49.0%
MARRIED-COUPLE HOUSEHOLDS
99.7/ 100
METRIC RATING
35th/ 347
METRIC RANK
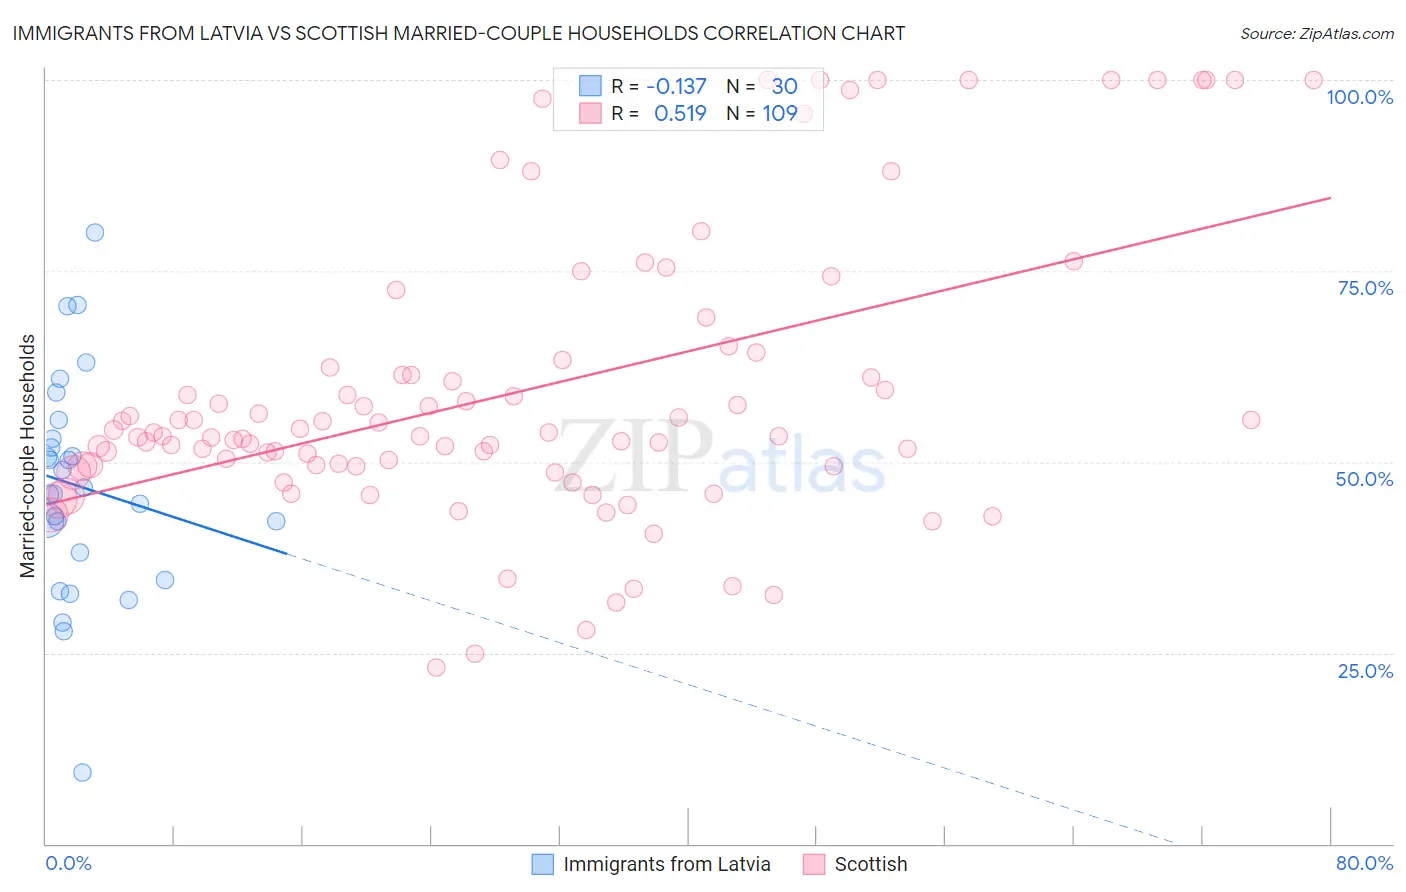
Immigrants from Latvia vs Scottish Married-couple Households Correlation Chart
The statistical analysis conducted on geographies consisting of 113,732,502 people shows a poor negative correlation between the proportion of Immigrants from Latvia and percentage of married-couple family households in the United States with a correlation coefficient (R) of -0.137 and weighted average of 46.0%. Similarly, the statistical analysis conducted on geographies consisting of 566,528,942 people shows a substantial positive correlation between the proportion of Scottish and percentage of married-couple family households in the United States with a correlation coefficient (R) of 0.519 and weighted average of 49.0%, a difference of 6.5%.
Married-couple Households Correlation Summary
| Measurement | Immigrants from Latvia | Scottish |
| Minimum | 9.2% | 23.1% |
| Maximum | 80.0% | 100.0% |
| Range | 70.8% | 76.9% |
| Mean | 46.8% | 59.2% |
| Median | 46.2% | 53.4% |
| Interquartile 25% (IQ1) | 38.2% | 49.4% |
| Interquartile 75% (IQ3) | 53.0% | 62.9% |
| Interquartile Range (IQR) | 14.8% | 13.5% |
| Standard Deviation (Sample) | 14.4% | 18.8% |
| Standard Deviation (Population) | 14.2% | 18.7% |
Similar Demographics by Married-couple Households
Demographics Similar to Immigrants from Latvia by Married-couple Households
In terms of married-couple households, the demographic groups most similar to Immigrants from Latvia are Immigrants from Kuwait (46.0%, a difference of 0.060%), South American Indian (46.0%, a difference of 0.070%), Choctaw (46.0%, a difference of 0.10%), Fijian (46.1%, a difference of 0.11%), and Immigrants from Northern Africa (46.0%, a difference of 0.11%).
| Demographics | Rating | Rank | Married-couple Households |
| Yugoslavians | 38.9 /100 | #182 | Fair 46.2% |
| Immigrants | Brazil | 38.3 /100 | #183 | Fair 46.2% |
| Immigrants | Switzerland | 36.9 /100 | #184 | Fair 46.2% |
| Brazilians | 35.9 /100 | #185 | Fair 46.2% |
| Albanians | 31.1 /100 | #186 | Fair 46.1% |
| Fijians | 29.2 /100 | #187 | Fair 46.1% |
| South American Indians | 28.4 /100 | #188 | Fair 46.0% |
| Immigrants | Latvia | 26.9 /100 | #189 | Fair 46.0% |
| Immigrants | Kuwait | 25.6 /100 | #190 | Fair 46.0% |
| Choctaw | 24.9 /100 | #191 | Fair 46.0% |
| Immigrants | Northern Africa | 24.6 /100 | #192 | Fair 46.0% |
| Taiwanese | 23.4 /100 | #193 | Fair 45.9% |
| Mexican American Indians | 23.3 /100 | #194 | Fair 45.9% |
| Chickasaw | 22.7 /100 | #195 | Fair 45.9% |
| Immigrants | South America | 22.2 /100 | #196 | Fair 45.9% |
Demographics Similar to Scottish by Married-couple Households
In terms of married-couple households, the demographic groups most similar to Scottish are Italian (49.0%, a difference of 0.020%), Iranian (49.0%, a difference of 0.090%), Sri Lankan (49.0%, a difference of 0.090%), Immigrants from Asia (49.1%, a difference of 0.10%), and Hungarian (49.1%, a difference of 0.13%).
| Demographics | Rating | Rank | Married-couple Households |
| Germans | 99.8 /100 | #28 | Exceptional 49.2% |
| Maltese | 99.8 /100 | #29 | Exceptional 49.2% |
| Bolivians | 99.8 /100 | #30 | Exceptional 49.2% |
| Native Hawaiians | 99.8 /100 | #31 | Exceptional 49.1% |
| Hungarians | 99.8 /100 | #32 | Exceptional 49.1% |
| Immigrants | Asia | 99.7 /100 | #33 | Exceptional 49.1% |
| Italians | 99.7 /100 | #34 | Exceptional 49.0% |
| Scottish | 99.7 /100 | #35 | Exceptional 49.0% |
| Iranians | 99.7 /100 | #36 | Exceptional 49.0% |
| Sri Lankans | 99.7 /100 | #37 | Exceptional 49.0% |
| Greeks | 99.7 /100 | #38 | Exceptional 48.9% |
| Lithuanians | 99.6 /100 | #39 | Exceptional 48.9% |
| Immigrants | Bolivia | 99.6 /100 | #40 | Exceptional 48.9% |
| Immigrants | Lebanon | 99.6 /100 | #41 | Exceptional 48.9% |
| Immigrants | Vietnam | 99.6 /100 | #42 | Exceptional 48.8% |