Immigrants from Laos vs Mexican Family Households
COMPARE
Immigrants from Laos
Mexican
Family Households
Family Households Comparison
Immigrants from Laos
Mexicans
65.3%
FAMILY HOUSEHOLDS
99.1/ 100
METRIC RATING
90th/ 347
METRIC RANK
69.0%
FAMILY HOUSEHOLDS
100.0/ 100
METRIC RATING
7th/ 347
METRIC RANK
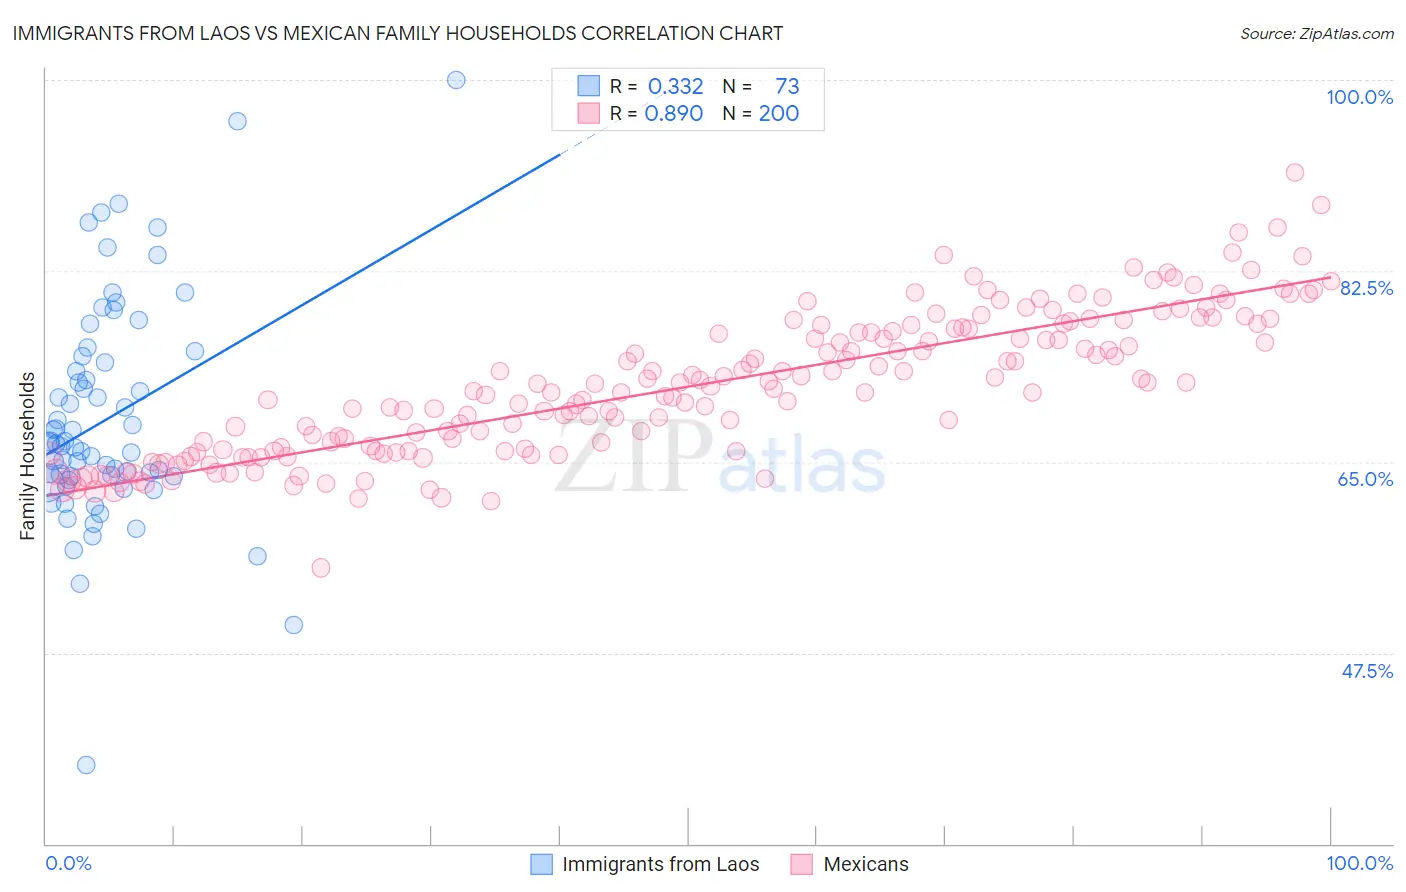
Immigrants from Laos vs Mexican Family Households Correlation Chart
The statistical analysis conducted on geographies consisting of 201,468,256 people shows a mild positive correlation between the proportion of Immigrants from Laos and percentage of family households in the United States with a correlation coefficient (R) of 0.332 and weighted average of 65.3%. Similarly, the statistical analysis conducted on geographies consisting of 564,667,700 people shows a very strong positive correlation between the proportion of Mexicans and percentage of family households in the United States with a correlation coefficient (R) of 0.890 and weighted average of 69.0%, a difference of 5.6%.
Family Households Correlation Summary
| Measurement | Immigrants from Laos | Mexican |
| Minimum | 37.2% | 55.3% |
| Maximum | 100.0% | 91.5% |
| Range | 62.8% | 36.2% |
| Mean | 69.0% | 71.9% |
| Median | 66.7% | 71.6% |
| Interquartile 25% (IQ1) | 63.5% | 66.0% |
| Interquartile 75% (IQ3) | 74.4% | 77.1% |
| Interquartile Range (IQR) | 10.9% | 11.1% |
| Standard Deviation (Sample) | 10.3% | 6.5% |
| Standard Deviation (Population) | 10.2% | 6.5% |
Similar Demographics by Family Households
Demographics Similar to Immigrants from Laos by Family Households
In terms of family households, the demographic groups most similar to Immigrants from Laos are Immigrants from Caribbean (65.3%, a difference of 0.010%), Immigrants from Haiti (65.3%, a difference of 0.020%), Immigrants from Egypt (65.3%, a difference of 0.050%), Crow (65.3%, a difference of 0.050%), and Hopi (65.3%, a difference of 0.090%).
| Demographics | Rating | Rank | Family Households |
| Immigrants | Guyana | 99.6 /100 | #83 | Exceptional 65.5% |
| Americans | 99.6 /100 | #84 | Exceptional 65.5% |
| Immigrants | Cambodia | 99.5 /100 | #85 | Exceptional 65.4% |
| Egyptians | 99.4 /100 | #86 | Exceptional 65.4% |
| Immigrants | Egypt | 99.2 /100 | #87 | Exceptional 65.3% |
| Immigrants | Haiti | 99.1 /100 | #88 | Exceptional 65.3% |
| Immigrants | Caribbean | 99.1 /100 | #89 | Exceptional 65.3% |
| Immigrants | Laos | 99.1 /100 | #90 | Exceptional 65.3% |
| Crow | 98.9 /100 | #91 | Exceptional 65.3% |
| Hopi | 98.8 /100 | #92 | Exceptional 65.3% |
| Guyanese | 98.8 /100 | #93 | Exceptional 65.3% |
| Immigrants | Poland | 98.7 /100 | #94 | Exceptional 65.2% |
| Immigrants | Portugal | 98.6 /100 | #95 | Exceptional 65.2% |
| Swiss | 98.6 /100 | #96 | Exceptional 65.2% |
| Guatemalans | 98.6 /100 | #97 | Exceptional 65.2% |
Demographics Similar to Mexicans by Family Households
In terms of family households, the demographic groups most similar to Mexicans are Immigrants from Mexico (69.1%, a difference of 0.21%), Immigrants from Fiji (68.8%, a difference of 0.32%), Yuman (69.3%, a difference of 0.45%), Yakama (69.3%, a difference of 0.47%), and Native Hawaiian (68.4%, a difference of 0.88%).
| Demographics | Rating | Rank | Family Households |
| Yup'ik | 100 /100 | #1 | Exceptional 72.4% |
| Spanish American Indians | 100.0 /100 | #2 | Exceptional 71.2% |
| Tongans | 100.0 /100 | #3 | Exceptional 69.6% |
| Yakama | 100.0 /100 | #4 | Exceptional 69.3% |
| Yuman | 100.0 /100 | #5 | Exceptional 69.3% |
| Immigrants | Mexico | 100.0 /100 | #6 | Exceptional 69.1% |
| Mexicans | 100.0 /100 | #7 | Exceptional 69.0% |
| Immigrants | Fiji | 100.0 /100 | #8 | Exceptional 68.8% |
| Native Hawaiians | 100.0 /100 | #9 | Exceptional 68.4% |
| Immigrants | Philippines | 100.0 /100 | #10 | Exceptional 68.3% |
| Immigrants | Central America | 100.0 /100 | #11 | Exceptional 68.3% |
| Koreans | 100.0 /100 | #12 | Exceptional 68.3% |
| Pueblo | 100.0 /100 | #13 | Exceptional 68.2% |
| Immigrants | Cuba | 100.0 /100 | #14 | Exceptional 68.2% |
| Assyrians/Chaldeans/Syriacs | 100.0 /100 | #15 | Exceptional 68.2% |