Finnish vs Mexican Family Households
COMPARE
Finnish
Mexican
Family Households
Family Households Comparison
Finns
Mexicans
63.5%
FAMILY HOUSEHOLDS
2.3/ 100
METRIC RATING
234th/ 347
METRIC RANK
69.0%
FAMILY HOUSEHOLDS
100.0/ 100
METRIC RATING
7th/ 347
METRIC RANK
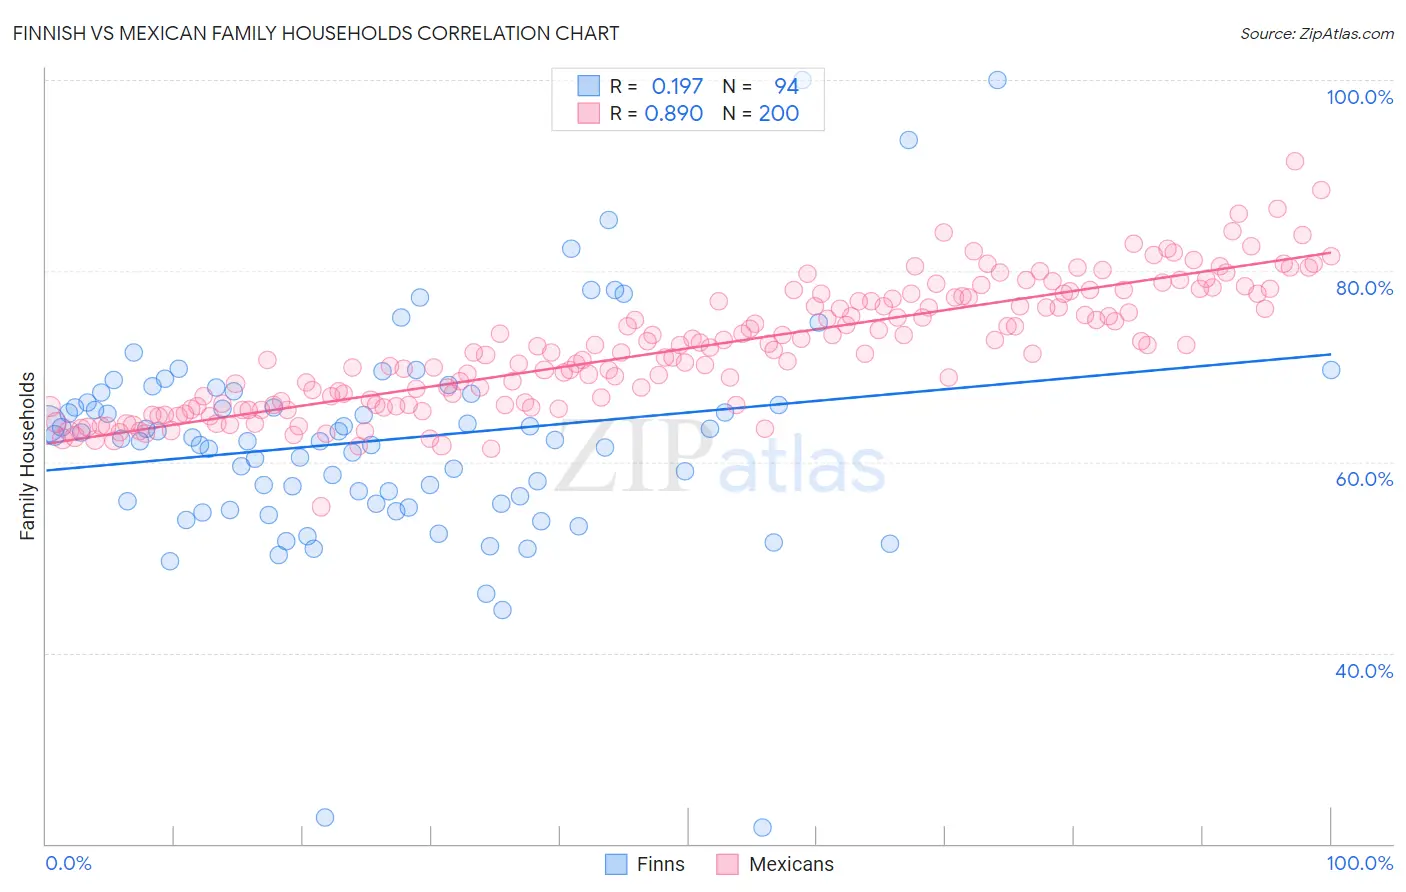
Finnish vs Mexican Family Households Correlation Chart
The statistical analysis conducted on geographies consisting of 404,508,203 people shows a poor positive correlation between the proportion of Finns and percentage of family households in the United States with a correlation coefficient (R) of 0.197 and weighted average of 63.5%. Similarly, the statistical analysis conducted on geographies consisting of 564,667,700 people shows a very strong positive correlation between the proportion of Mexicans and percentage of family households in the United States with a correlation coefficient (R) of 0.890 and weighted average of 69.0%, a difference of 8.6%.
Family Households Correlation Summary
| Measurement | Finnish | Mexican |
| Minimum | 21.6% | 55.3% |
| Maximum | 100.0% | 91.5% |
| Range | 78.4% | 36.2% |
| Mean | 62.3% | 71.9% |
| Median | 62.4% | 71.6% |
| Interquartile 25% (IQ1) | 55.6% | 66.0% |
| Interquartile 75% (IQ3) | 67.1% | 77.1% |
| Interquartile Range (IQR) | 11.5% | 11.1% |
| Standard Deviation (Sample) | 11.6% | 6.5% |
| Standard Deviation (Population) | 11.6% | 6.5% |
Similar Demographics by Family Households
Demographics Similar to Finns by Family Households
In terms of family households, the demographic groups most similar to Finns are Immigrants from Armenia (63.5%, a difference of 0.030%), Albanian (63.5%, a difference of 0.030%), Immigrants from Northern Africa (63.5%, a difference of 0.040%), Ghanaian (63.5%, a difference of 0.040%), and Comanche (63.5%, a difference of 0.040%).
| Demographics | Rating | Rank | Family Households |
| Trinidadians and Tobagonians | 4.1 /100 | #227 | Tragic 63.6% |
| Blackfeet | 3.6 /100 | #228 | Tragic 63.6% |
| Bulgarians | 3.4 /100 | #229 | Tragic 63.6% |
| Immigrants | Brazil | 3.0 /100 | #230 | Tragic 63.6% |
| Immigrants | Greece | 2.9 /100 | #231 | Tragic 63.5% |
| Immigrants | Northern Africa | 2.6 /100 | #232 | Tragic 63.5% |
| Immigrants | Armenia | 2.6 /100 | #233 | Tragic 63.5% |
| Finns | 2.3 /100 | #234 | Tragic 63.5% |
| Albanians | 2.2 /100 | #235 | Tragic 63.5% |
| Ghanaians | 2.1 /100 | #236 | Tragic 63.5% |
| Comanche | 2.1 /100 | #237 | Tragic 63.5% |
| Immigrants | Zimbabwe | 2.0 /100 | #238 | Tragic 63.5% |
| Aleuts | 1.9 /100 | #239 | Tragic 63.4% |
| South Africans | 1.9 /100 | #240 | Tragic 63.4% |
| Immigrants | St. Vincent and the Grenadines | 1.9 /100 | #241 | Tragic 63.4% |
Demographics Similar to Mexicans by Family Households
In terms of family households, the demographic groups most similar to Mexicans are Immigrants from Mexico (69.1%, a difference of 0.21%), Immigrants from Fiji (68.8%, a difference of 0.32%), Yuman (69.3%, a difference of 0.45%), Yakama (69.3%, a difference of 0.47%), and Native Hawaiian (68.4%, a difference of 0.88%).
| Demographics | Rating | Rank | Family Households |
| Yup'ik | 100 /100 | #1 | Exceptional 72.4% |
| Spanish American Indians | 100.0 /100 | #2 | Exceptional 71.2% |
| Tongans | 100.0 /100 | #3 | Exceptional 69.6% |
| Yakama | 100.0 /100 | #4 | Exceptional 69.3% |
| Yuman | 100.0 /100 | #5 | Exceptional 69.3% |
| Immigrants | Mexico | 100.0 /100 | #6 | Exceptional 69.1% |
| Mexicans | 100.0 /100 | #7 | Exceptional 69.0% |
| Immigrants | Fiji | 100.0 /100 | #8 | Exceptional 68.8% |
| Native Hawaiians | 100.0 /100 | #9 | Exceptional 68.4% |
| Immigrants | Philippines | 100.0 /100 | #10 | Exceptional 68.3% |
| Immigrants | Central America | 100.0 /100 | #11 | Exceptional 68.3% |
| Koreans | 100.0 /100 | #12 | Exceptional 68.3% |
| Pueblo | 100.0 /100 | #13 | Exceptional 68.2% |
| Immigrants | Cuba | 100.0 /100 | #14 | Exceptional 68.2% |
| Assyrians/Chaldeans/Syriacs | 100.0 /100 | #15 | Exceptional 68.2% |