Haitian vs Mexican Family Households
COMPARE
Haitian
Mexican
Family Households
Family Households Comparison
Haitians
Mexicans
65.2%
FAMILY HOUSEHOLDS
98.1/ 100
METRIC RATING
100th/ 347
METRIC RANK
69.0%
FAMILY HOUSEHOLDS
100.0/ 100
METRIC RATING
7th/ 347
METRIC RANK
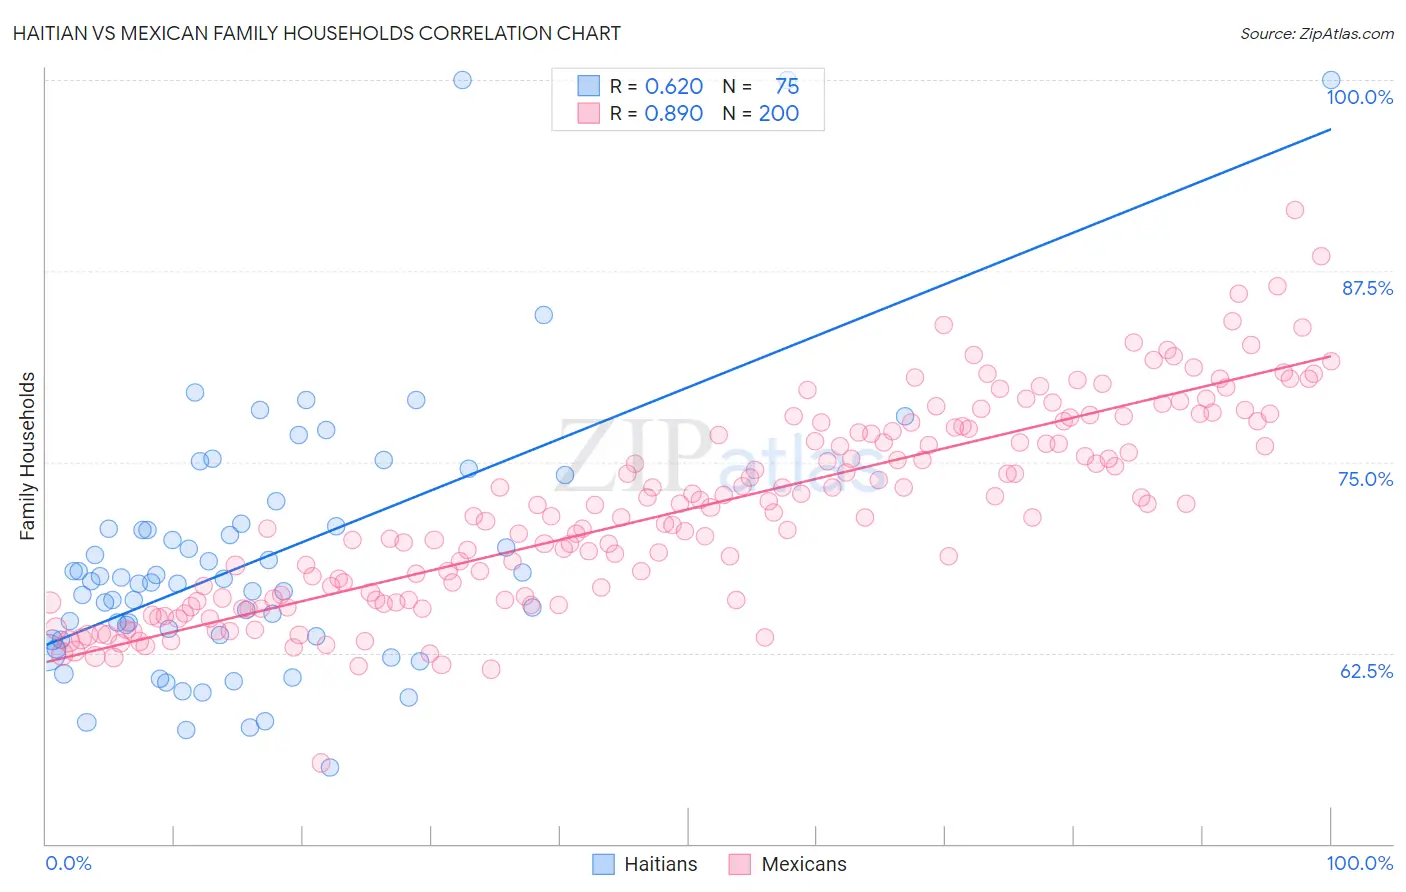
Haitian vs Mexican Family Households Correlation Chart
The statistical analysis conducted on geographies consisting of 287,715,427 people shows a significant positive correlation between the proportion of Haitians and percentage of family households in the United States with a correlation coefficient (R) of 0.620 and weighted average of 65.2%. Similarly, the statistical analysis conducted on geographies consisting of 564,667,700 people shows a very strong positive correlation between the proportion of Mexicans and percentage of family households in the United States with a correlation coefficient (R) of 0.890 and weighted average of 69.0%, a difference of 5.9%.
Family Households Correlation Summary
| Measurement | Haitian | Mexican |
| Minimum | 55.0% | 55.3% |
| Maximum | 100.0% | 91.5% |
| Range | 45.0% | 36.2% |
| Mean | 68.6% | 71.9% |
| Median | 67.1% | 71.6% |
| Interquartile 25% (IQ1) | 63.4% | 66.0% |
| Interquartile 75% (IQ3) | 70.8% | 77.1% |
| Interquartile Range (IQR) | 7.4% | 11.1% |
| Standard Deviation (Sample) | 8.8% | 6.5% |
| Standard Deviation (Population) | 8.7% | 6.5% |
Similar Demographics by Family Households
Demographics Similar to Haitians by Family Households
In terms of family households, the demographic groups most similar to Haitians are Chilean (65.2%, a difference of 0.0%), Immigrants from Sri Lanka (65.1%, a difference of 0.020%), Central American Indian (65.2%, a difference of 0.040%), Indian (Asian) (65.1%, a difference of 0.040%), and Spaniard (65.1%, a difference of 0.040%).
| Demographics | Rating | Rank | Family Households |
| Guyanese | 98.8 /100 | #93 | Exceptional 65.3% |
| Immigrants | Poland | 98.7 /100 | #94 | Exceptional 65.2% |
| Immigrants | Portugal | 98.6 /100 | #95 | Exceptional 65.2% |
| Swiss | 98.6 /100 | #96 | Exceptional 65.2% |
| Guatemalans | 98.6 /100 | #97 | Exceptional 65.2% |
| Immigrants | Syria | 98.4 /100 | #98 | Exceptional 65.2% |
| Central American Indians | 98.3 /100 | #99 | Exceptional 65.2% |
| Haitians | 98.1 /100 | #100 | Exceptional 65.2% |
| Chileans | 98.1 /100 | #101 | Exceptional 65.2% |
| Immigrants | Sri Lanka | 98.0 /100 | #102 | Exceptional 65.1% |
| Indians (Asian) | 97.9 /100 | #103 | Exceptional 65.1% |
| Spaniards | 97.8 /100 | #104 | Exceptional 65.1% |
| English | 97.4 /100 | #105 | Exceptional 65.1% |
| Whites/Caucasians | 97.3 /100 | #106 | Exceptional 65.1% |
| Alaska Natives | 97.3 /100 | #107 | Exceptional 65.1% |
Demographics Similar to Mexicans by Family Households
In terms of family households, the demographic groups most similar to Mexicans are Immigrants from Mexico (69.1%, a difference of 0.21%), Immigrants from Fiji (68.8%, a difference of 0.32%), Yuman (69.3%, a difference of 0.45%), Yakama (69.3%, a difference of 0.47%), and Native Hawaiian (68.4%, a difference of 0.88%).
| Demographics | Rating | Rank | Family Households |
| Yup'ik | 100 /100 | #1 | Exceptional 72.4% |
| Spanish American Indians | 100.0 /100 | #2 | Exceptional 71.2% |
| Tongans | 100.0 /100 | #3 | Exceptional 69.6% |
| Yakama | 100.0 /100 | #4 | Exceptional 69.3% |
| Yuman | 100.0 /100 | #5 | Exceptional 69.3% |
| Immigrants | Mexico | 100.0 /100 | #6 | Exceptional 69.1% |
| Mexicans | 100.0 /100 | #7 | Exceptional 69.0% |
| Immigrants | Fiji | 100.0 /100 | #8 | Exceptional 68.8% |
| Native Hawaiians | 100.0 /100 | #9 | Exceptional 68.4% |
| Immigrants | Philippines | 100.0 /100 | #10 | Exceptional 68.3% |
| Immigrants | Central America | 100.0 /100 | #11 | Exceptional 68.3% |
| Koreans | 100.0 /100 | #12 | Exceptional 68.3% |
| Pueblo | 100.0 /100 | #13 | Exceptional 68.2% |
| Immigrants | Cuba | 100.0 /100 | #14 | Exceptional 68.2% |
| Assyrians/Chaldeans/Syriacs | 100.0 /100 | #15 | Exceptional 68.2% |