Immigrants from Portugal vs Honduran Family Households
COMPARE
Immigrants from Portugal
Honduran
Family Households
Family Households Comparison
Immigrants from Portugal
Hondurans
65.2%
FAMILY HOUSEHOLDS
98.6/ 100
METRIC RATING
95th/ 347
METRIC RANK
64.4%
FAMILY HOUSEHOLDS
57.5/ 100
METRIC RATING
168th/ 347
METRIC RANK
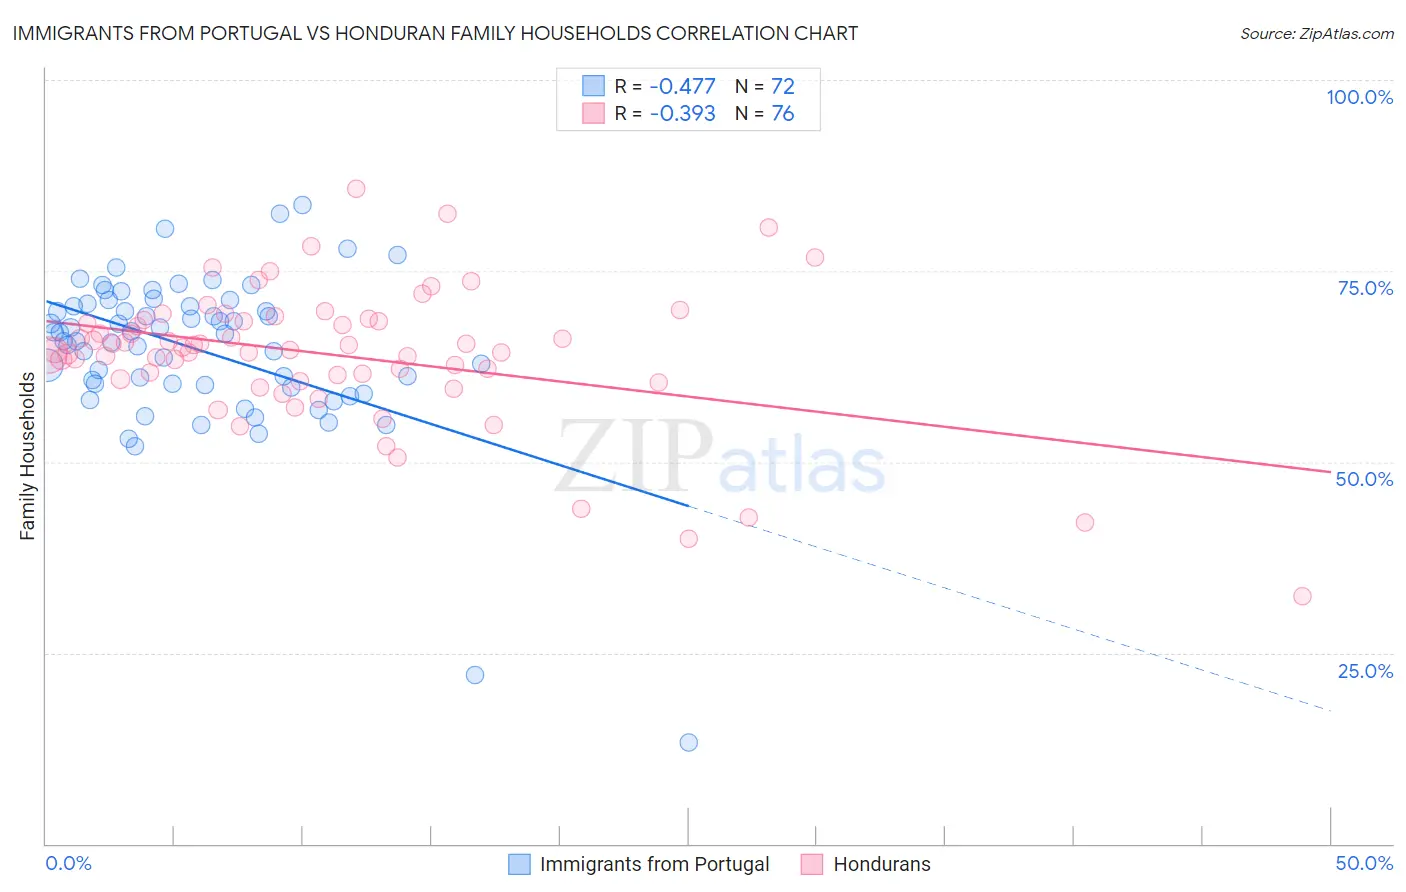
Immigrants from Portugal vs Honduran Family Households Correlation Chart
The statistical analysis conducted on geographies consisting of 174,766,633 people shows a moderate negative correlation between the proportion of Immigrants from Portugal and percentage of family households in the United States with a correlation coefficient (R) of -0.477 and weighted average of 65.2%. Similarly, the statistical analysis conducted on geographies consisting of 357,606,635 people shows a mild negative correlation between the proportion of Hondurans and percentage of family households in the United States with a correlation coefficient (R) of -0.393 and weighted average of 64.4%, a difference of 1.3%.
Family Households Correlation Summary
| Measurement | Immigrants from Portugal | Honduran |
| Minimum | 13.2% | 32.4% |
| Maximum | 83.6% | 85.8% |
| Range | 70.4% | 53.5% |
| Mean | 64.7% | 64.1% |
| Median | 66.8% | 64.8% |
| Interquartile 25% (IQ1) | 60.1% | 61.2% |
| Interquartile 75% (IQ3) | 70.5% | 68.5% |
| Interquartile Range (IQR) | 10.4% | 7.3% |
| Standard Deviation (Sample) | 10.7% | 9.1% |
| Standard Deviation (Population) | 10.6% | 9.0% |
Similar Demographics by Family Households
Demographics Similar to Immigrants from Portugal by Family Households
In terms of family households, the demographic groups most similar to Immigrants from Portugal are Swiss (65.2%, a difference of 0.010%), Guatemalan (65.2%, a difference of 0.010%), Immigrants from Poland (65.2%, a difference of 0.030%), Guyanese (65.3%, a difference of 0.040%), and Hopi (65.3%, a difference of 0.050%).
| Demographics | Rating | Rank | Family Households |
| Immigrants | Haiti | 99.1 /100 | #88 | Exceptional 65.3% |
| Immigrants | Caribbean | 99.1 /100 | #89 | Exceptional 65.3% |
| Immigrants | Laos | 99.1 /100 | #90 | Exceptional 65.3% |
| Crow | 98.9 /100 | #91 | Exceptional 65.3% |
| Hopi | 98.8 /100 | #92 | Exceptional 65.3% |
| Guyanese | 98.8 /100 | #93 | Exceptional 65.3% |
| Immigrants | Poland | 98.7 /100 | #94 | Exceptional 65.2% |
| Immigrants | Portugal | 98.6 /100 | #95 | Exceptional 65.2% |
| Swiss | 98.6 /100 | #96 | Exceptional 65.2% |
| Guatemalans | 98.6 /100 | #97 | Exceptional 65.2% |
| Immigrants | Syria | 98.4 /100 | #98 | Exceptional 65.2% |
| Central American Indians | 98.3 /100 | #99 | Exceptional 65.2% |
| Haitians | 98.1 /100 | #100 | Exceptional 65.2% |
| Chileans | 98.1 /100 | #101 | Exceptional 65.2% |
| Immigrants | Sri Lanka | 98.0 /100 | #102 | Exceptional 65.1% |
Demographics Similar to Hondurans by Family Households
In terms of family households, the demographic groups most similar to Hondurans are Irish (64.4%, a difference of 0.010%), Scotch-Irish (64.4%, a difference of 0.020%), Iraqi (64.4%, a difference of 0.020%), Armenian (64.4%, a difference of 0.020%), and Immigrants from Nigeria (64.4%, a difference of 0.040%).
| Demographics | Rating | Rank | Family Households |
| Immigrants | England | 62.6 /100 | #161 | Good 64.4% |
| British | 61.6 /100 | #162 | Good 64.4% |
| Chickasaw | 61.5 /100 | #163 | Good 64.4% |
| Immigrants | Nigeria | 60.1 /100 | #164 | Good 64.4% |
| Immigrants | Southern Europe | 60.0 /100 | #165 | Good 64.4% |
| Scotch-Irish | 59.2 /100 | #166 | Average 64.4% |
| Irish | 57.9 /100 | #167 | Average 64.4% |
| Hondurans | 57.5 /100 | #168 | Average 64.4% |
| Iraqis | 56.0 /100 | #169 | Average 64.4% |
| Armenians | 55.9 /100 | #170 | Average 64.4% |
| Ute | 54.6 /100 | #171 | Average 64.3% |
| Dutch West Indians | 53.9 /100 | #172 | Average 64.3% |
| Immigrants | Sierra Leone | 52.5 /100 | #173 | Average 64.3% |
| Immigrants | Germany | 50.0 /100 | #174 | Average 64.3% |
| Bangladeshis | 44.3 /100 | #175 | Average 64.3% |