Yugoslavian vs Honduran Family Households
COMPARE
Yugoslavian
Honduran
Family Households
Family Households Comparison
Yugoslavians
Hondurans
63.1%
FAMILY HOUSEHOLDS
0.4/ 100
METRIC RATING
269th/ 347
METRIC RANK
64.4%
FAMILY HOUSEHOLDS
57.5/ 100
METRIC RATING
168th/ 347
METRIC RANK
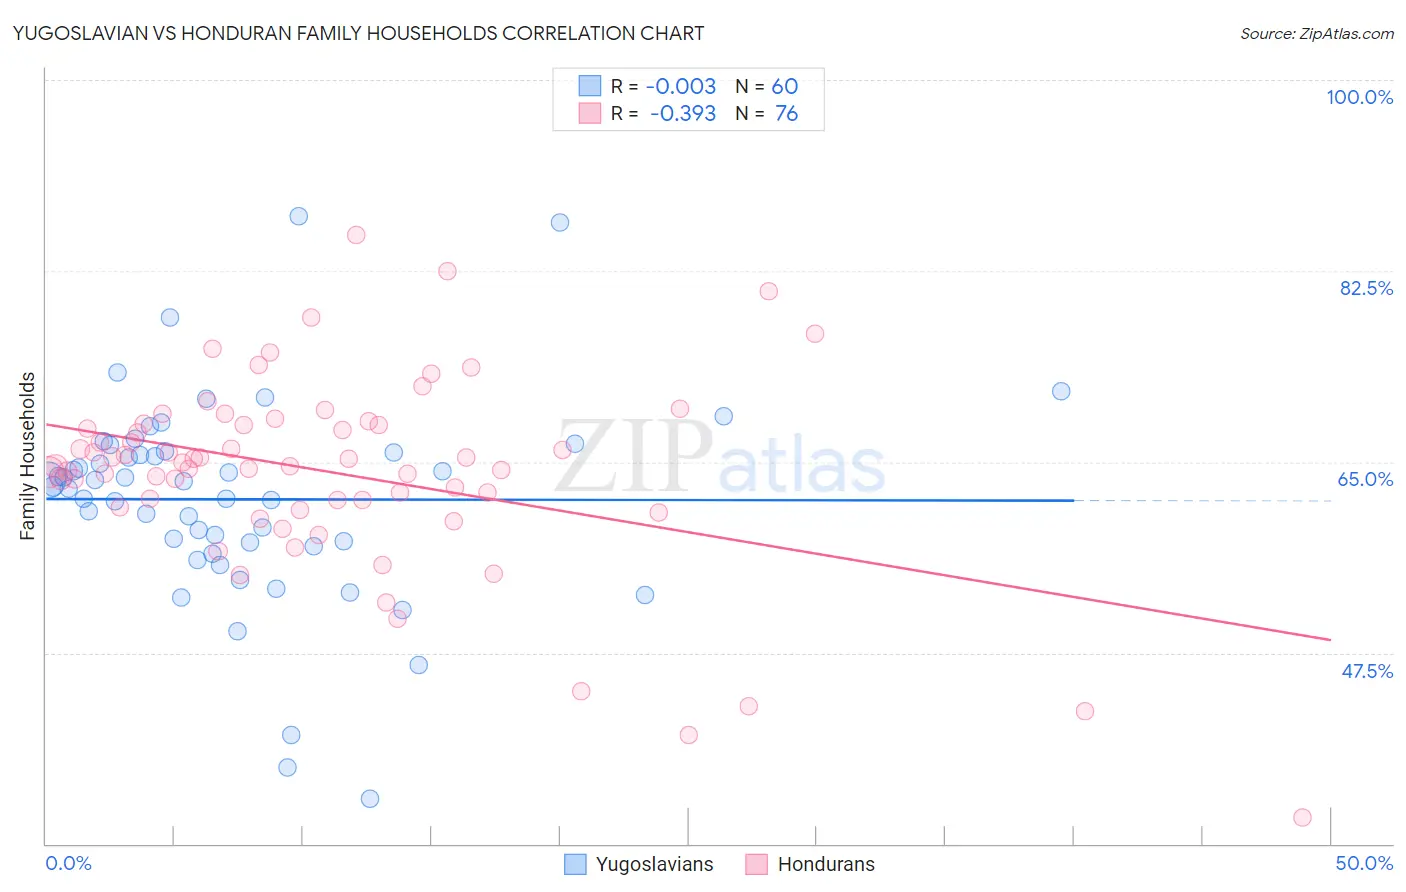
Yugoslavian vs Honduran Family Households Correlation Chart
The statistical analysis conducted on geographies consisting of 285,640,029 people shows no correlation between the proportion of Yugoslavians and percentage of family households in the United States with a correlation coefficient (R) of -0.003 and weighted average of 63.1%. Similarly, the statistical analysis conducted on geographies consisting of 357,606,635 people shows a mild negative correlation between the proportion of Hondurans and percentage of family households in the United States with a correlation coefficient (R) of -0.393 and weighted average of 64.4%, a difference of 2.0%.
Family Households Correlation Summary
| Measurement | Yugoslavian | Honduran |
| Minimum | 34.1% | 32.4% |
| Maximum | 87.5% | 85.8% |
| Range | 53.4% | 53.5% |
| Mean | 61.6% | 64.1% |
| Median | 62.9% | 64.8% |
| Interquartile 25% (IQ1) | 57.5% | 61.2% |
| Interquartile 75% (IQ3) | 65.9% | 68.5% |
| Interquartile Range (IQR) | 8.5% | 7.3% |
| Standard Deviation (Sample) | 9.4% | 9.1% |
| Standard Deviation (Population) | 9.4% | 9.0% |
Similar Demographics by Family Households
Demographics Similar to Yugoslavians by Family Households
In terms of family households, the demographic groups most similar to Yugoslavians are Immigrants from Singapore (63.1%, a difference of 0.0%), Immigrants from Austria (63.1%, a difference of 0.020%), Immigrants from Croatia (63.1%, a difference of 0.030%), Immigrants from Turkey (63.1%, a difference of 0.030%), and Immigrants from Kazakhstan (63.1%, a difference of 0.040%).
| Demographics | Rating | Rank | Family Households |
| Immigrants | Ireland | 0.6 /100 | #262 | Tragic 63.2% |
| Cheyenne | 0.5 /100 | #263 | Tragic 63.2% |
| Kenyans | 0.5 /100 | #264 | Tragic 63.2% |
| Colville | 0.5 /100 | #265 | Tragic 63.2% |
| Immigrants | Western Africa | 0.5 /100 | #266 | Tragic 63.1% |
| Israelis | 0.4 /100 | #267 | Tragic 63.1% |
| Immigrants | Singapore | 0.4 /100 | #268 | Tragic 63.1% |
| Yugoslavians | 0.4 /100 | #269 | Tragic 63.1% |
| Immigrants | Austria | 0.3 /100 | #270 | Tragic 63.1% |
| Immigrants | Croatia | 0.3 /100 | #271 | Tragic 63.1% |
| Immigrants | Turkey | 0.3 /100 | #272 | Tragic 63.1% |
| Immigrants | Kazakhstan | 0.3 /100 | #273 | Tragic 63.1% |
| Lumbee | 0.3 /100 | #274 | Tragic 63.1% |
| West Indians | 0.3 /100 | #275 | Tragic 63.1% |
| Serbians | 0.3 /100 | #276 | Tragic 63.0% |
Demographics Similar to Hondurans by Family Households
In terms of family households, the demographic groups most similar to Hondurans are Irish (64.4%, a difference of 0.010%), Scotch-Irish (64.4%, a difference of 0.020%), Iraqi (64.4%, a difference of 0.020%), Armenian (64.4%, a difference of 0.020%), and Immigrants from Nigeria (64.4%, a difference of 0.040%).
| Demographics | Rating | Rank | Family Households |
| Immigrants | England | 62.6 /100 | #161 | Good 64.4% |
| British | 61.6 /100 | #162 | Good 64.4% |
| Chickasaw | 61.5 /100 | #163 | Good 64.4% |
| Immigrants | Nigeria | 60.1 /100 | #164 | Good 64.4% |
| Immigrants | Southern Europe | 60.0 /100 | #165 | Good 64.4% |
| Scotch-Irish | 59.2 /100 | #166 | Average 64.4% |
| Irish | 57.9 /100 | #167 | Average 64.4% |
| Hondurans | 57.5 /100 | #168 | Average 64.4% |
| Iraqis | 56.0 /100 | #169 | Average 64.4% |
| Armenians | 55.9 /100 | #170 | Average 64.4% |
| Ute | 54.6 /100 | #171 | Average 64.3% |
| Dutch West Indians | 53.9 /100 | #172 | Average 64.3% |
| Immigrants | Sierra Leone | 52.5 /100 | #173 | Average 64.3% |
| Immigrants | Germany | 50.0 /100 | #174 | Average 64.3% |
| Bangladeshis | 44.3 /100 | #175 | Average 64.3% |