Immigrants from Kuwait vs Swedish Family Households
COMPARE
Immigrants from Kuwait
Swedish
Family Households
Family Households Comparison
Immigrants from Kuwait
Swedes
62.4%
FAMILY HOUSEHOLDS
0.0/ 100
METRIC RATING
299th/ 347
METRIC RANK
64.5%
FAMILY HOUSEHOLDS
69.8/ 100
METRIC RATING
153rd/ 347
METRIC RANK
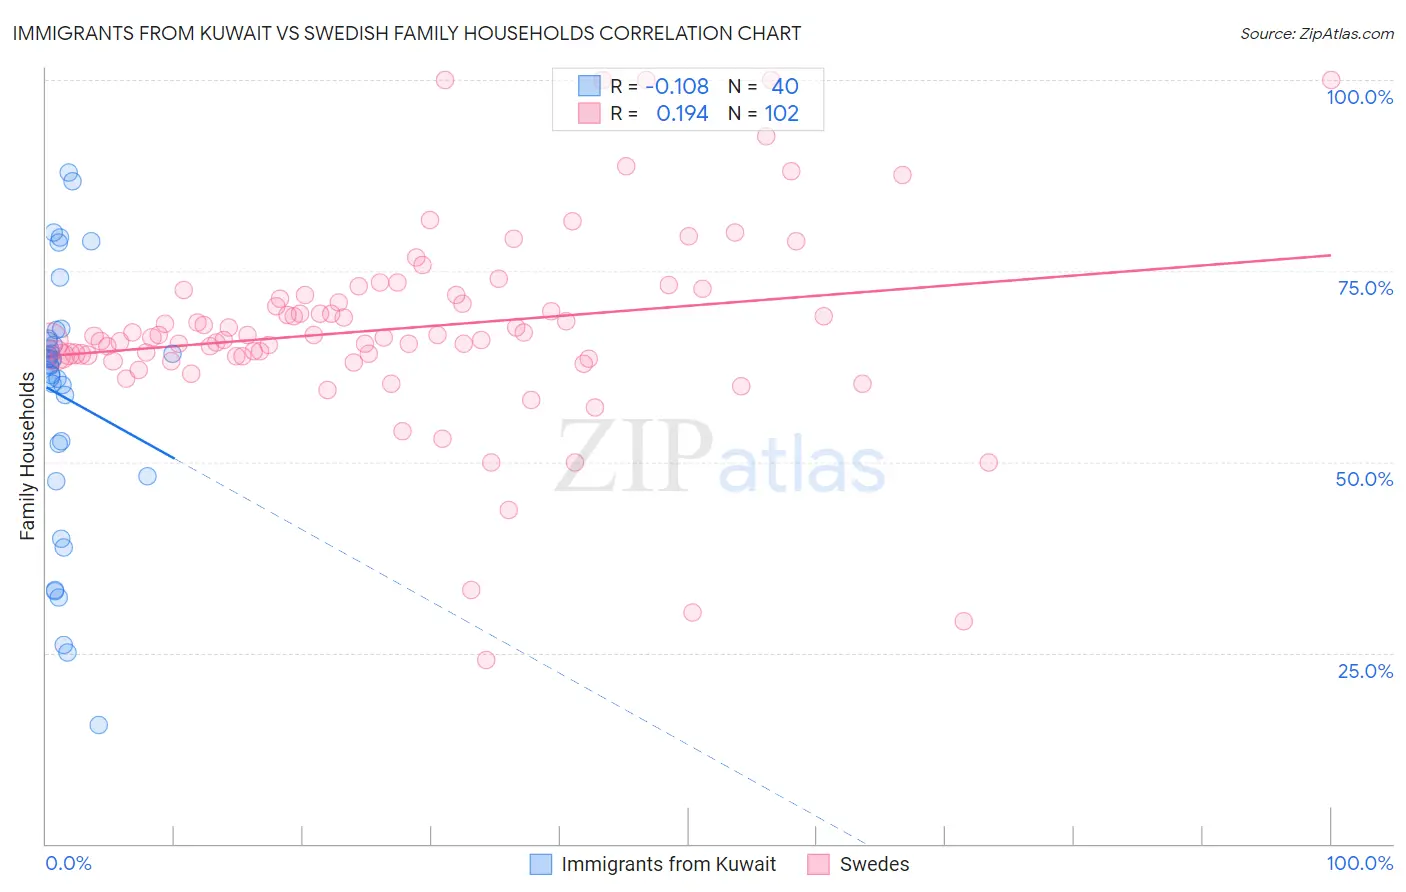
Immigrants from Kuwait vs Swedish Family Households Correlation Chart
The statistical analysis conducted on geographies consisting of 136,888,250 people shows a poor negative correlation between the proportion of Immigrants from Kuwait and percentage of family households in the United States with a correlation coefficient (R) of -0.108 and weighted average of 62.4%. Similarly, the statistical analysis conducted on geographies consisting of 538,762,235 people shows a poor positive correlation between the proportion of Swedes and percentage of family households in the United States with a correlation coefficient (R) of 0.194 and weighted average of 64.5%, a difference of 3.4%.
Family Households Correlation Summary
| Measurement | Immigrants from Kuwait | Swedish |
| Minimum | 15.6% | 24.0% |
| Maximum | 87.9% | 100.0% |
| Range | 72.2% | 76.0% |
| Mean | 58.5% | 67.5% |
| Median | 63.0% | 66.4% |
| Interquartile 25% (IQ1) | 50.2% | 63.8% |
| Interquartile 75% (IQ3) | 66.0% | 71.8% |
| Interquartile Range (IQR) | 15.8% | 8.0% |
| Standard Deviation (Sample) | 17.0% | 13.1% |
| Standard Deviation (Population) | 16.8% | 13.0% |
Similar Demographics by Family Households
Demographics Similar to Immigrants from Kuwait by Family Households
In terms of family households, the demographic groups most similar to Immigrants from Kuwait are Immigrants from Africa (62.4%, a difference of 0.0%), Immigrants from Albania (62.4%, a difference of 0.030%), Immigrants from Spain (62.4%, a difference of 0.060%), Immigrants from Kenya (62.3%, a difference of 0.070%), and French American Indian (62.4%, a difference of 0.090%).
| Demographics | Rating | Rank | Family Households |
| Immigrants | Burma/Myanmar | 0.0 /100 | #292 | Tragic 62.6% |
| Immigrants | Sweden | 0.0 /100 | #293 | Tragic 62.5% |
| Barbadians | 0.0 /100 | #294 | Tragic 62.5% |
| Okinawans | 0.0 /100 | #295 | Tragic 62.5% |
| Slovenes | 0.0 /100 | #296 | Tragic 62.4% |
| French American Indians | 0.0 /100 | #297 | Tragic 62.4% |
| Immigrants | Spain | 0.0 /100 | #298 | Tragic 62.4% |
| Immigrants | Kuwait | 0.0 /100 | #299 | Tragic 62.4% |
| Immigrants | Africa | 0.0 /100 | #300 | Tragic 62.4% |
| Immigrants | Albania | 0.0 /100 | #301 | Tragic 62.4% |
| Immigrants | Kenya | 0.0 /100 | #302 | Tragic 62.3% |
| Cree | 0.0 /100 | #303 | Tragic 62.3% |
| Iroquois | 0.0 /100 | #304 | Tragic 62.2% |
| Bermudans | 0.0 /100 | #305 | Tragic 62.2% |
| Africans | 0.0 /100 | #306 | Tragic 62.1% |
Demographics Similar to Swedes by Family Households
In terms of family households, the demographic groups most similar to Swedes are Scottish (64.5%, a difference of 0.020%), Austrian (64.5%, a difference of 0.020%), Uruguayan (64.5%, a difference of 0.030%), Czech (64.5%, a difference of 0.040%), and Canadian (64.4%, a difference of 0.050%).
| Demographics | Rating | Rank | Family Households |
| Immigrants | Romania | 77.0 /100 | #146 | Good 64.6% |
| Immigrants | Chile | 76.5 /100 | #147 | Good 64.6% |
| Delaware | 76.3 /100 | #148 | Good 64.6% |
| Sioux | 76.3 /100 | #149 | Good 64.6% |
| Romanians | 75.3 /100 | #150 | Good 64.5% |
| Syrians | 75.2 /100 | #151 | Good 64.5% |
| Scottish | 70.9 /100 | #152 | Good 64.5% |
| Swedes | 69.8 /100 | #153 | Good 64.5% |
| Austrians | 68.5 /100 | #154 | Good 64.5% |
| Uruguayans | 67.7 /100 | #155 | Good 64.5% |
| Czechs | 67.0 /100 | #156 | Good 64.5% |
| Canadians | 66.6 /100 | #157 | Good 64.4% |
| Lebanese | 66.4 /100 | #158 | Good 64.4% |
| Germans | 65.8 /100 | #159 | Good 64.4% |
| Immigrants | Moldova | 65.2 /100 | #160 | Good 64.4% |