Immigrants from Korea vs White/Caucasian Average Family Size
COMPARE
Immigrants from Korea
White/Caucasian
Average Family Size
Average Family Size Comparison
Immigrants from Korea
Whites/Caucasians
3.23
AVERAGE FAMILY SIZE
46.9/ 100
METRIC RATING
179th/ 347
METRIC RANK
3.14
AVERAGE FAMILY SIZE
0.3/ 100
METRIC RATING
285th/ 347
METRIC RANK
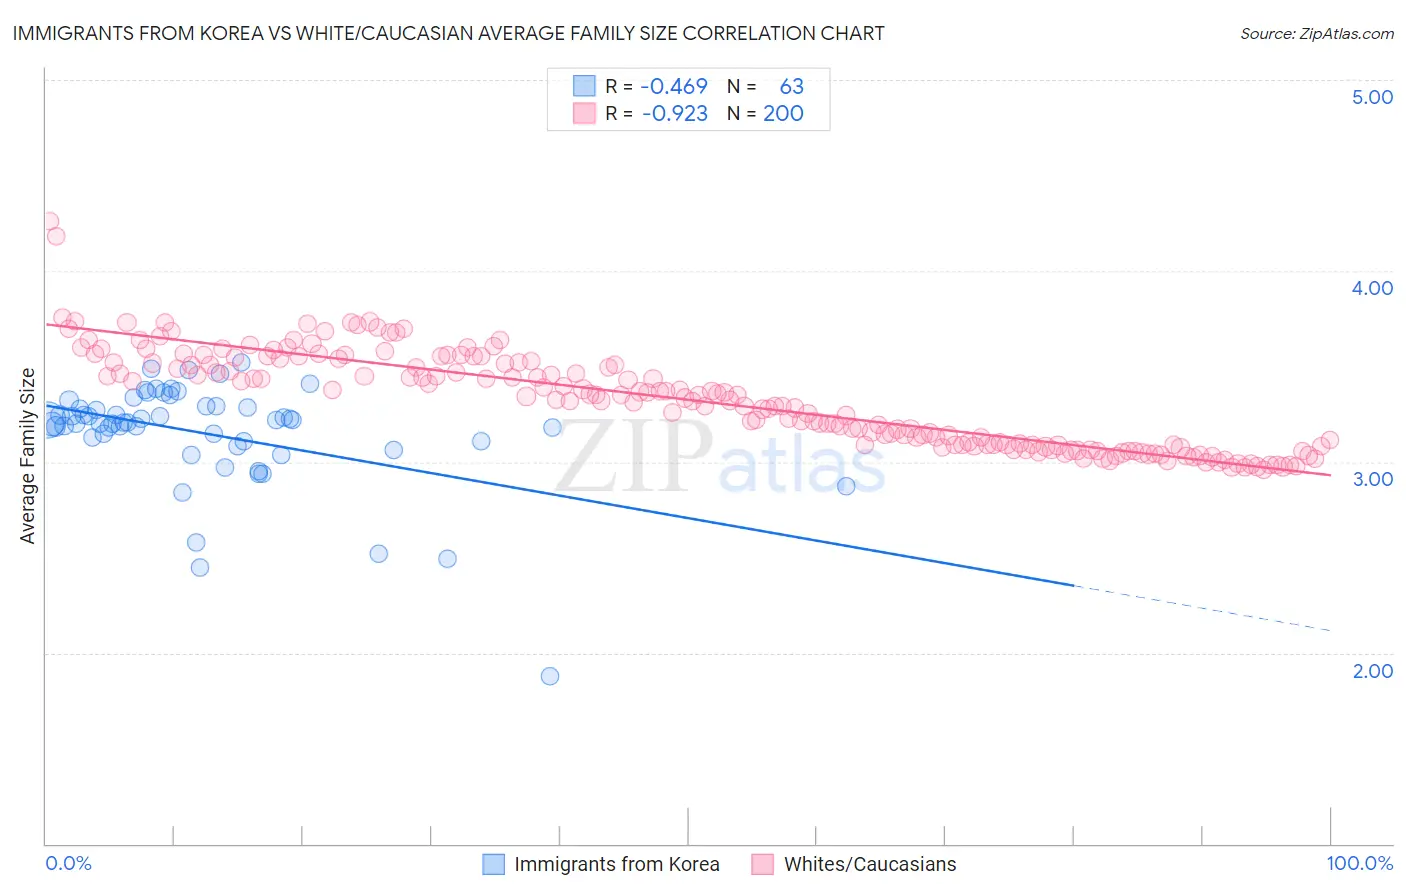
Immigrants from Korea vs White/Caucasian Average Family Size Correlation Chart
The statistical analysis conducted on geographies consisting of 415,975,423 people shows a moderate negative correlation between the proportion of Immigrants from Korea and average family size in the United States with a correlation coefficient (R) of -0.469 and weighted average of 3.23. Similarly, the statistical analysis conducted on geographies consisting of 584,525,704 people shows a near-perfect negative correlation between the proportion of Whites/Caucasians and average family size in the United States with a correlation coefficient (R) of -0.923 and weighted average of 3.14, a difference of 2.6%.
Average Family Size Correlation Summary
| Measurement | Immigrants from Korea | White/Caucasian |
| Minimum | 1.88 | 2.96 |
| Maximum | 3.52 | 4.26 |
| Range | 1.64 | 1.30 |
| Mean | 3.15 | 3.32 |
| Median | 3.21 | 3.33 |
| Interquartile 25% (IQ1) | 3.11 | 3.09 |
| Interquartile 75% (IQ3) | 3.29 | 3.52 |
| Interquartile Range (IQR) | 0.18 | 0.43 |
| Standard Deviation (Sample) | 0.28 | 0.25 |
| Standard Deviation (Population) | 0.27 | 0.25 |
Similar Demographics by Average Family Size
Demographics Similar to Immigrants from Korea by Average Family Size
In terms of average family size, the demographic groups most similar to Immigrants from Korea are Argentinean (3.23, a difference of 0.010%), Spaniard (3.23, a difference of 0.010%), Palestinian (3.23, a difference of 0.010%), Israeli (3.23, a difference of 0.030%), and Spanish (3.23, a difference of 0.040%).
| Demographics | Rating | Rank | Average Family Size |
| Immigrants | Congo | 52.7 /100 | #172 | Average 3.23 |
| Immigrants | Uruguay | 52.0 /100 | #173 | Average 3.23 |
| Immigrants | South Central Asia | 50.0 /100 | #174 | Average 3.23 |
| Immigrants | China | 49.9 /100 | #175 | Average 3.23 |
| Israelis | 48.7 /100 | #176 | Average 3.23 |
| Argentineans | 47.4 /100 | #177 | Average 3.23 |
| Spaniards | 47.2 /100 | #178 | Average 3.23 |
| Immigrants | Korea | 46.9 /100 | #179 | Average 3.23 |
| Palestinians | 46.6 /100 | #180 | Average 3.23 |
| Spanish | 44.8 /100 | #181 | Average 3.23 |
| Moroccans | 44.2 /100 | #182 | Average 3.22 |
| Immigrants | Northern Africa | 41.7 /100 | #183 | Average 3.22 |
| Immigrants | Eastern Asia | 40.8 /100 | #184 | Average 3.22 |
| Immigrants | Sri Lanka | 39.8 /100 | #185 | Fair 3.22 |
| Immigrants | Argentina | 39.8 /100 | #186 | Fair 3.22 |
Demographics Similar to Whites/Caucasians by Average Family Size
In terms of average family size, the demographic groups most similar to Whites/Caucasians are Immigrants from France (3.15, a difference of 0.050%), Immigrants from Netherlands (3.14, a difference of 0.050%), Greek (3.14, a difference of 0.060%), Immigrants from Czechoslovakia (3.14, a difference of 0.060%), and Immigrants from Norway (3.14, a difference of 0.060%).
| Demographics | Rating | Rank | Average Family Size |
| Okinawans | 0.5 /100 | #278 | Tragic 3.15 |
| Immigrants | Europe | 0.5 /100 | #279 | Tragic 3.15 |
| Immigrants | England | 0.4 /100 | #280 | Tragic 3.15 |
| Immigrants | Denmark | 0.4 /100 | #281 | Tragic 3.15 |
| Yugoslavians | 0.4 /100 | #282 | Tragic 3.15 |
| German Russians | 0.4 /100 | #283 | Tragic 3.15 |
| Immigrants | France | 0.4 /100 | #284 | Tragic 3.15 |
| Whites/Caucasians | 0.3 /100 | #285 | Tragic 3.14 |
| Immigrants | Netherlands | 0.3 /100 | #286 | Tragic 3.14 |
| Greeks | 0.3 /100 | #287 | Tragic 3.14 |
| Immigrants | Czechoslovakia | 0.3 /100 | #288 | Tragic 3.14 |
| Immigrants | Norway | 0.3 /100 | #289 | Tragic 3.14 |
| Cypriots | 0.3 /100 | #290 | Tragic 3.14 |
| Alsatians | 0.2 /100 | #291 | Tragic 3.14 |
| Europeans | 0.2 /100 | #292 | Tragic 3.14 |