Immigrants from Korea vs Haitian Average Family Size
COMPARE
Immigrants from Korea
Haitian
Average Family Size
Average Family Size Comparison
Immigrants from Korea
Haitians
3.23
AVERAGE FAMILY SIZE
46.9/ 100
METRIC RATING
179th/ 347
METRIC RANK
3.37
AVERAGE FAMILY SIZE
100.0/ 100
METRIC RATING
46th/ 347
METRIC RANK
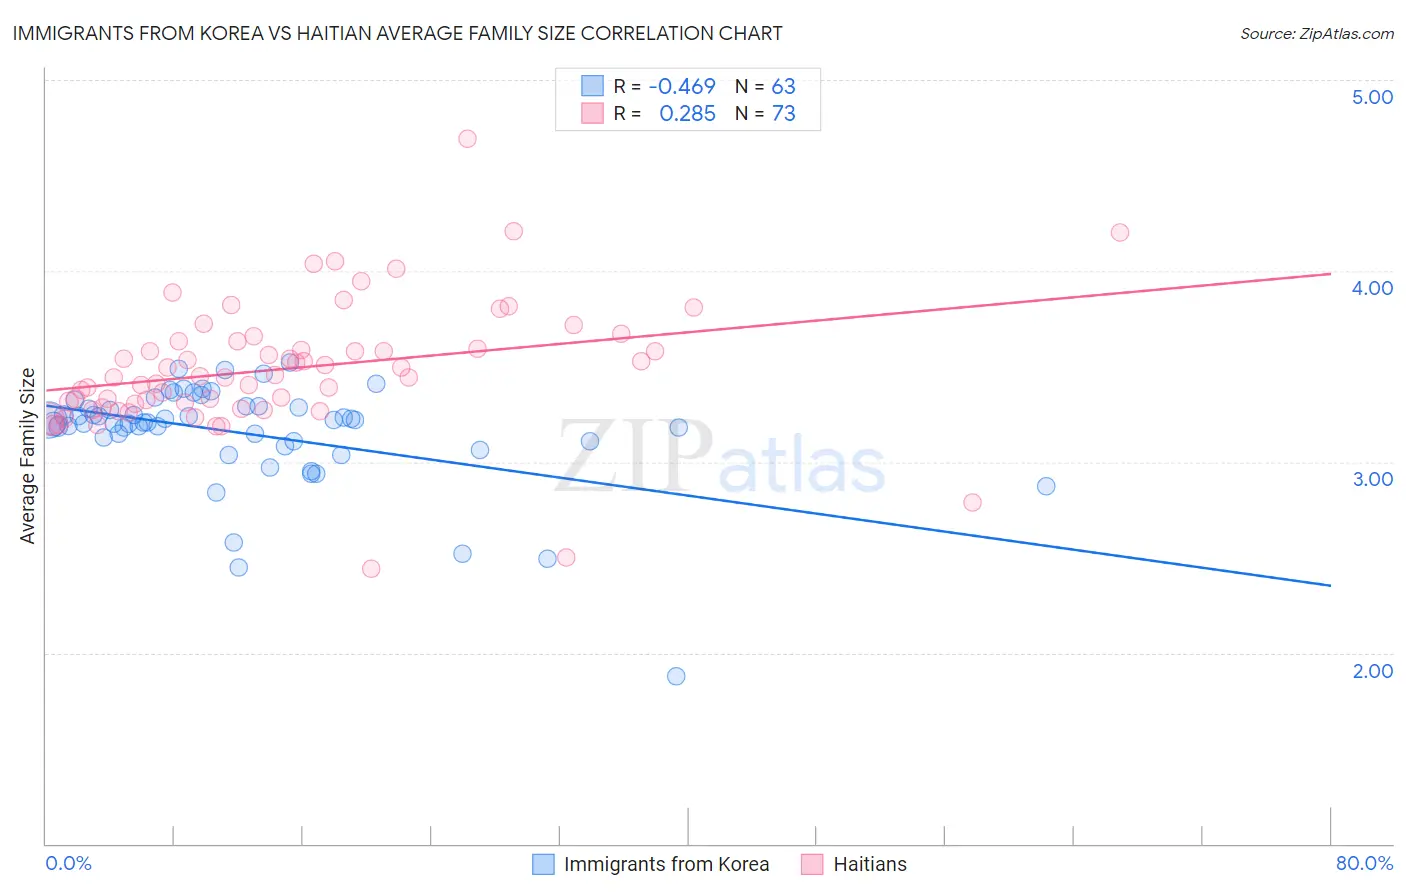
Immigrants from Korea vs Haitian Average Family Size Correlation Chart
The statistical analysis conducted on geographies consisting of 415,975,423 people shows a moderate negative correlation between the proportion of Immigrants from Korea and average family size in the United States with a correlation coefficient (R) of -0.469 and weighted average of 3.23. Similarly, the statistical analysis conducted on geographies consisting of 287,712,478 people shows a weak positive correlation between the proportion of Haitians and average family size in the United States with a correlation coefficient (R) of 0.285 and weighted average of 3.37, a difference of 4.5%.
Average Family Size Correlation Summary
| Measurement | Immigrants from Korea | Haitian |
| Minimum | 1.88 | 2.44 |
| Maximum | 3.52 | 4.69 |
| Range | 1.64 | 2.25 |
| Mean | 3.15 | 3.49 |
| Median | 3.21 | 3.45 |
| Interquartile 25% (IQ1) | 3.11 | 3.30 |
| Interquartile 75% (IQ3) | 3.29 | 3.63 |
| Interquartile Range (IQR) | 0.18 | 0.33 |
| Standard Deviation (Sample) | 0.28 | 0.34 |
| Standard Deviation (Population) | 0.27 | 0.34 |
Similar Demographics by Average Family Size
Demographics Similar to Immigrants from Korea by Average Family Size
In terms of average family size, the demographic groups most similar to Immigrants from Korea are Argentinean (3.23, a difference of 0.010%), Spaniard (3.23, a difference of 0.010%), Palestinian (3.23, a difference of 0.010%), Israeli (3.23, a difference of 0.030%), and Spanish (3.23, a difference of 0.040%).
| Demographics | Rating | Rank | Average Family Size |
| Immigrants | Congo | 52.7 /100 | #172 | Average 3.23 |
| Immigrants | Uruguay | 52.0 /100 | #173 | Average 3.23 |
| Immigrants | South Central Asia | 50.0 /100 | #174 | Average 3.23 |
| Immigrants | China | 49.9 /100 | #175 | Average 3.23 |
| Israelis | 48.7 /100 | #176 | Average 3.23 |
| Argentineans | 47.4 /100 | #177 | Average 3.23 |
| Spaniards | 47.2 /100 | #178 | Average 3.23 |
| Immigrants | Korea | 46.9 /100 | #179 | Average 3.23 |
| Palestinians | 46.6 /100 | #180 | Average 3.23 |
| Spanish | 44.8 /100 | #181 | Average 3.23 |
| Moroccans | 44.2 /100 | #182 | Average 3.22 |
| Immigrants | Northern Africa | 41.7 /100 | #183 | Average 3.22 |
| Immigrants | Eastern Asia | 40.8 /100 | #184 | Average 3.22 |
| Immigrants | Sri Lanka | 39.8 /100 | #185 | Fair 3.22 |
| Immigrants | Argentina | 39.8 /100 | #186 | Fair 3.22 |
Demographics Similar to Haitians by Average Family Size
In terms of average family size, the demographic groups most similar to Haitians are Vietnamese (3.37, a difference of 0.040%), Immigrants from Nicaragua (3.37, a difference of 0.040%), Shoshone (3.37, a difference of 0.060%), Alaska Native (3.37, a difference of 0.090%), and Immigrants from Philippines (3.37, a difference of 0.10%).
| Demographics | Rating | Rank | Average Family Size |
| Immigrants | Haiti | 100.0 /100 | #39 | Exceptional 3.39 |
| Belizeans | 100.0 /100 | #40 | Exceptional 3.39 |
| Marshallese | 100.0 /100 | #41 | Exceptional 3.38 |
| Immigrants | Vietnam | 100.0 /100 | #42 | Exceptional 3.38 |
| Immigrants | Philippines | 100.0 /100 | #43 | Exceptional 3.37 |
| Alaska Natives | 100.0 /100 | #44 | Exceptional 3.37 |
| Shoshone | 100.0 /100 | #45 | Exceptional 3.37 |
| Haitians | 100.0 /100 | #46 | Exceptional 3.37 |
| Vietnamese | 100.0 /100 | #47 | Exceptional 3.37 |
| Immigrants | Nicaragua | 100.0 /100 | #48 | Exceptional 3.37 |
| Bangladeshis | 100.0 /100 | #49 | Exceptional 3.37 |
| Immigrants | Bangladesh | 100.0 /100 | #50 | Exceptional 3.36 |
| Nicaraguans | 100.0 /100 | #51 | Exceptional 3.36 |
| Fijians | 100.0 /100 | #52 | Exceptional 3.36 |
| Koreans | 100.0 /100 | #53 | Exceptional 3.36 |