Immigrants from Jordan vs Polish Single Mother Households
COMPARE
Immigrants from Jordan
Polish
Single Mother Households
Single Mother Households Comparison
Immigrants from Jordan
Poles
6.0%
SINGLE MOTHER HOUSEHOLDS
82.3/ 100
METRIC RATING
147th/ 347
METRIC RANK
5.6%
SINGLE MOTHER HOUSEHOLDS
98.6/ 100
METRIC RATING
62nd/ 347
METRIC RANK
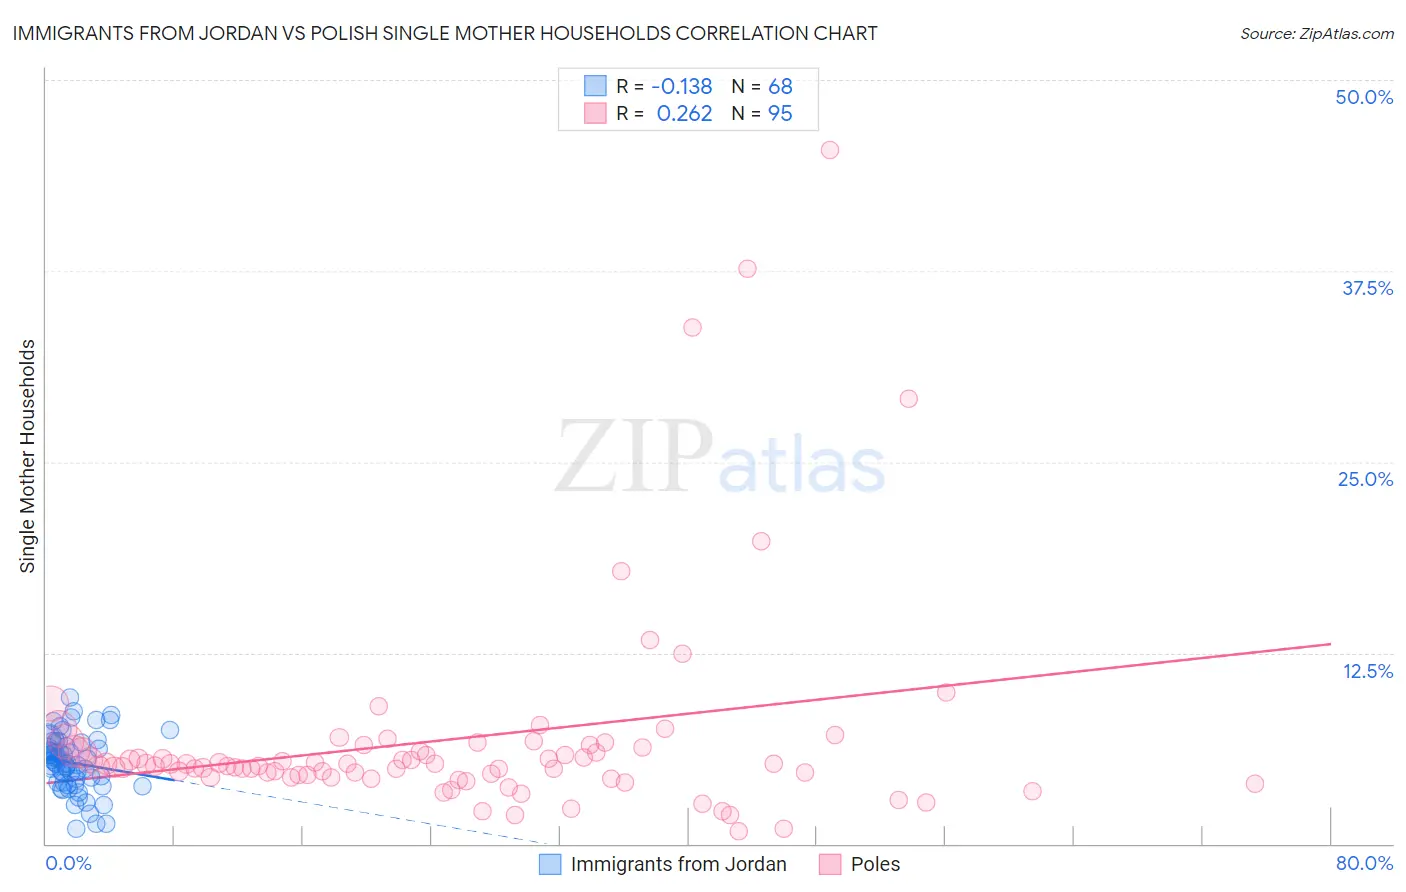
Immigrants from Jordan vs Polish Single Mother Households Correlation Chart
The statistical analysis conducted on geographies consisting of 181,167,128 people shows a poor negative correlation between the proportion of Immigrants from Jordan and percentage of single mother households in the United States with a correlation coefficient (R) of -0.138 and weighted average of 6.0%. Similarly, the statistical analysis conducted on geographies consisting of 555,545,245 people shows a weak positive correlation between the proportion of Poles and percentage of single mother households in the United States with a correlation coefficient (R) of 0.262 and weighted average of 5.6%, a difference of 8.5%.
Single Mother Households Correlation Summary
| Measurement | Immigrants from Jordan | Polish |
| Minimum | 0.95% | 0.85% |
| Maximum | 9.6% | 45.5% |
| Range | 8.7% | 44.6% |
| Mean | 5.3% | 6.8% |
| Median | 5.3% | 5.2% |
| Interquartile 25% (IQ1) | 4.0% | 4.4% |
| Interquartile 75% (IQ3) | 6.5% | 6.3% |
| Interquartile Range (IQR) | 2.5% | 1.9% |
| Standard Deviation (Sample) | 1.8% | 7.0% |
| Standard Deviation (Population) | 1.8% | 6.9% |
Similar Demographics by Single Mother Households
Demographics Similar to Immigrants from Jordan by Single Mother Households
In terms of single mother households, the demographic groups most similar to Immigrants from Jordan are Scotch-Irish (6.0%, a difference of 0.050%), French Canadian (6.0%, a difference of 0.060%), Immigrants from Albania (6.1%, a difference of 0.15%), Zimbabwean (6.1%, a difference of 0.29%), and Immigrants from Southern Europe (6.1%, a difference of 0.34%).
| Demographics | Rating | Rank | Single Mother Households |
| French | 85.7 /100 | #140 | Excellent 6.0% |
| Tsimshian | 85.2 /100 | #141 | Excellent 6.0% |
| Immigrants | Egypt | 85.0 /100 | #142 | Excellent 6.0% |
| Immigrants | Iraq | 84.8 /100 | #143 | Excellent 6.0% |
| Koreans | 84.4 /100 | #144 | Excellent 6.0% |
| Arabs | 84.0 /100 | #145 | Excellent 6.0% |
| French Canadians | 82.6 /100 | #146 | Excellent 6.0% |
| Immigrants | Jordan | 82.3 /100 | #147 | Excellent 6.0% |
| Scotch-Irish | 82.0 /100 | #148 | Excellent 6.0% |
| Immigrants | Albania | 81.5 /100 | #149 | Excellent 6.1% |
| Zimbabweans | 80.7 /100 | #150 | Excellent 6.1% |
| Immigrants | Southern Europe | 80.5 /100 | #151 | Excellent 6.1% |
| Pakistanis | 79.2 /100 | #152 | Good 6.1% |
| Immigrants | Brazil | 78.9 /100 | #153 | Good 6.1% |
| Immigrants | Philippines | 78.5 /100 | #154 | Good 6.1% |
Demographics Similar to Poles by Single Mother Households
In terms of single mother households, the demographic groups most similar to Poles are Australian (5.6%, a difference of 0.010%), Immigrants from North Macedonia (5.6%, a difference of 0.070%), Immigrants from Norway (5.6%, a difference of 0.080%), Immigrants from France (5.6%, a difference of 0.10%), and Greek (5.6%, a difference of 0.15%).
| Demographics | Rating | Rank | Single Mother Households |
| Immigrants | Denmark | 99.1 /100 | #55 | Exceptional 5.5% |
| Immigrants | Romania | 99.0 /100 | #56 | Exceptional 5.5% |
| Immigrants | Europe | 99.0 /100 | #57 | Exceptional 5.5% |
| Danes | 98.9 /100 | #58 | Exceptional 5.5% |
| Luxembourgers | 98.7 /100 | #59 | Exceptional 5.6% |
| Immigrants | Norway | 98.7 /100 | #60 | Exceptional 5.6% |
| Australians | 98.7 /100 | #61 | Exceptional 5.6% |
| Poles | 98.6 /100 | #62 | Exceptional 5.6% |
| Immigrants | North Macedonia | 98.6 /100 | #63 | Exceptional 5.6% |
| Immigrants | France | 98.6 /100 | #64 | Exceptional 5.6% |
| Greeks | 98.6 /100 | #65 | Exceptional 5.6% |
| Immigrants | Canada | 98.5 /100 | #66 | Exceptional 5.6% |
| Italians | 98.5 /100 | #67 | Exceptional 5.6% |
| Immigrants | Bulgaria | 98.5 /100 | #68 | Exceptional 5.6% |
| Asians | 98.5 /100 | #69 | Exceptional 5.6% |