Immigrants from Sweden vs Polish Single Mother Households
COMPARE
Immigrants from Sweden
Polish
Single Mother Households
Single Mother Households Comparison
Immigrants from Sweden
Poles
5.4%
SINGLE MOTHER HOUSEHOLDS
99.6/ 100
METRIC RATING
39th/ 347
METRIC RANK
5.6%
SINGLE MOTHER HOUSEHOLDS
98.6/ 100
METRIC RATING
62nd/ 347
METRIC RANK
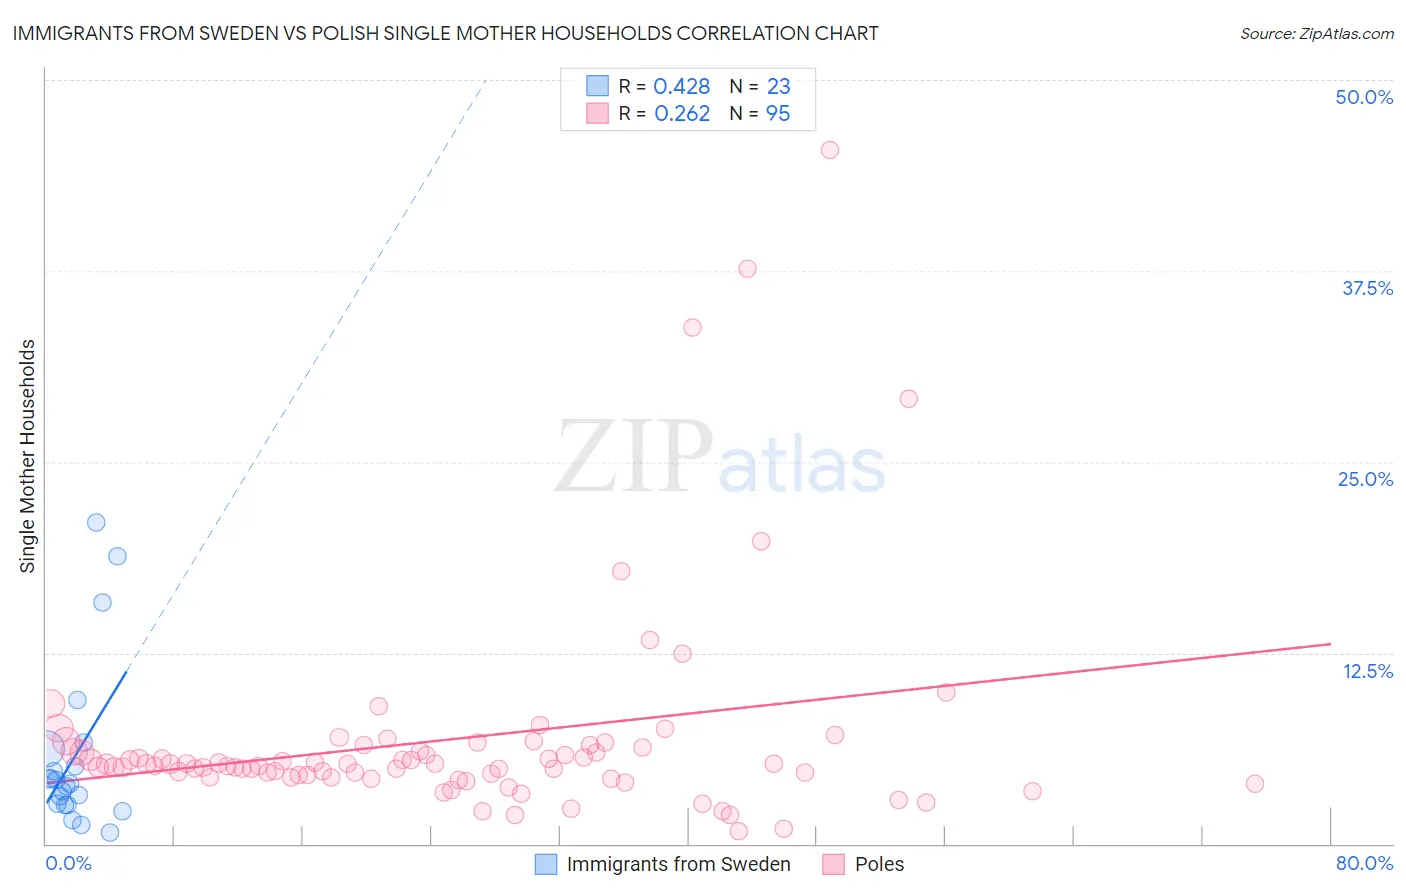
Immigrants from Sweden vs Polish Single Mother Households Correlation Chart
The statistical analysis conducted on geographies consisting of 164,354,075 people shows a moderate positive correlation between the proportion of Immigrants from Sweden and percentage of single mother households in the United States with a correlation coefficient (R) of 0.428 and weighted average of 5.4%. Similarly, the statistical analysis conducted on geographies consisting of 555,545,245 people shows a weak positive correlation between the proportion of Poles and percentage of single mother households in the United States with a correlation coefficient (R) of 0.262 and weighted average of 5.6%, a difference of 3.9%.
Single Mother Households Correlation Summary
| Measurement | Immigrants from Sweden | Polish |
| Minimum | 0.71% | 0.85% |
| Maximum | 21.1% | 45.5% |
| Range | 20.3% | 44.6% |
| Mean | 5.7% | 6.8% |
| Median | 3.9% | 5.2% |
| Interquartile 25% (IQ1) | 2.5% | 4.4% |
| Interquartile 75% (IQ3) | 6.2% | 6.3% |
| Interquartile Range (IQR) | 3.7% | 1.9% |
| Standard Deviation (Sample) | 5.5% | 7.0% |
| Standard Deviation (Population) | 5.4% | 6.9% |
Similar Demographics by Single Mother Households
Demographics Similar to Immigrants from Sweden by Single Mother Households
In terms of single mother households, the demographic groups most similar to Immigrants from Sweden are Estonian (5.4%, a difference of 0.11%), Immigrants from Serbia (5.4%, a difference of 0.14%), Immigrants from Greece (5.4%, a difference of 0.53%), Immigrants from Belgium (5.3%, a difference of 0.58%), and Macedonian (5.4%, a difference of 0.61%).
| Demographics | Rating | Rank | Single Mother Households |
| Cambodians | 99.7 /100 | #32 | Exceptional 5.3% |
| Immigrants | Switzerland | 99.7 /100 | #33 | Exceptional 5.3% |
| Bulgarians | 99.7 /100 | #34 | Exceptional 5.3% |
| Immigrants | Northern Europe | 99.7 /100 | #35 | Exceptional 5.3% |
| Immigrants | Czechoslovakia | 99.7 /100 | #36 | Exceptional 5.3% |
| Immigrants | Belgium | 99.7 /100 | #37 | Exceptional 5.3% |
| Immigrants | Serbia | 99.6 /100 | #38 | Exceptional 5.4% |
| Immigrants | Sweden | 99.6 /100 | #39 | Exceptional 5.4% |
| Estonians | 99.6 /100 | #40 | Exceptional 5.4% |
| Immigrants | Greece | 99.5 /100 | #41 | Exceptional 5.4% |
| Macedonians | 99.5 /100 | #42 | Exceptional 5.4% |
| Immigrants | South Central Asia | 99.5 /100 | #43 | Exceptional 5.4% |
| Lithuanians | 99.4 /100 | #44 | Exceptional 5.4% |
| Immigrants | Croatia | 99.4 /100 | #45 | Exceptional 5.4% |
| Croatians | 99.3 /100 | #46 | Exceptional 5.5% |
Demographics Similar to Poles by Single Mother Households
In terms of single mother households, the demographic groups most similar to Poles are Australian (5.6%, a difference of 0.010%), Immigrants from North Macedonia (5.6%, a difference of 0.070%), Immigrants from Norway (5.6%, a difference of 0.080%), Immigrants from France (5.6%, a difference of 0.10%), and Greek (5.6%, a difference of 0.15%).
| Demographics | Rating | Rank | Single Mother Households |
| Immigrants | Denmark | 99.1 /100 | #55 | Exceptional 5.5% |
| Immigrants | Romania | 99.0 /100 | #56 | Exceptional 5.5% |
| Immigrants | Europe | 99.0 /100 | #57 | Exceptional 5.5% |
| Danes | 98.9 /100 | #58 | Exceptional 5.5% |
| Luxembourgers | 98.7 /100 | #59 | Exceptional 5.6% |
| Immigrants | Norway | 98.7 /100 | #60 | Exceptional 5.6% |
| Australians | 98.7 /100 | #61 | Exceptional 5.6% |
| Poles | 98.6 /100 | #62 | Exceptional 5.6% |
| Immigrants | North Macedonia | 98.6 /100 | #63 | Exceptional 5.6% |
| Immigrants | France | 98.6 /100 | #64 | Exceptional 5.6% |
| Greeks | 98.6 /100 | #65 | Exceptional 5.6% |
| Immigrants | Canada | 98.5 /100 | #66 | Exceptional 5.6% |
| Italians | 98.5 /100 | #67 | Exceptional 5.6% |
| Immigrants | Bulgaria | 98.5 /100 | #68 | Exceptional 5.6% |
| Asians | 98.5 /100 | #69 | Exceptional 5.6% |