Brazilian vs Polish Single Mother Households
COMPARE
Brazilian
Polish
Single Mother Households
Single Mother Households Comparison
Brazilians
Poles
6.2%
SINGLE MOTHER HOUSEHOLDS
59.1/ 100
METRIC RATING
167th/ 347
METRIC RANK
5.6%
SINGLE MOTHER HOUSEHOLDS
98.6/ 100
METRIC RATING
62nd/ 347
METRIC RANK
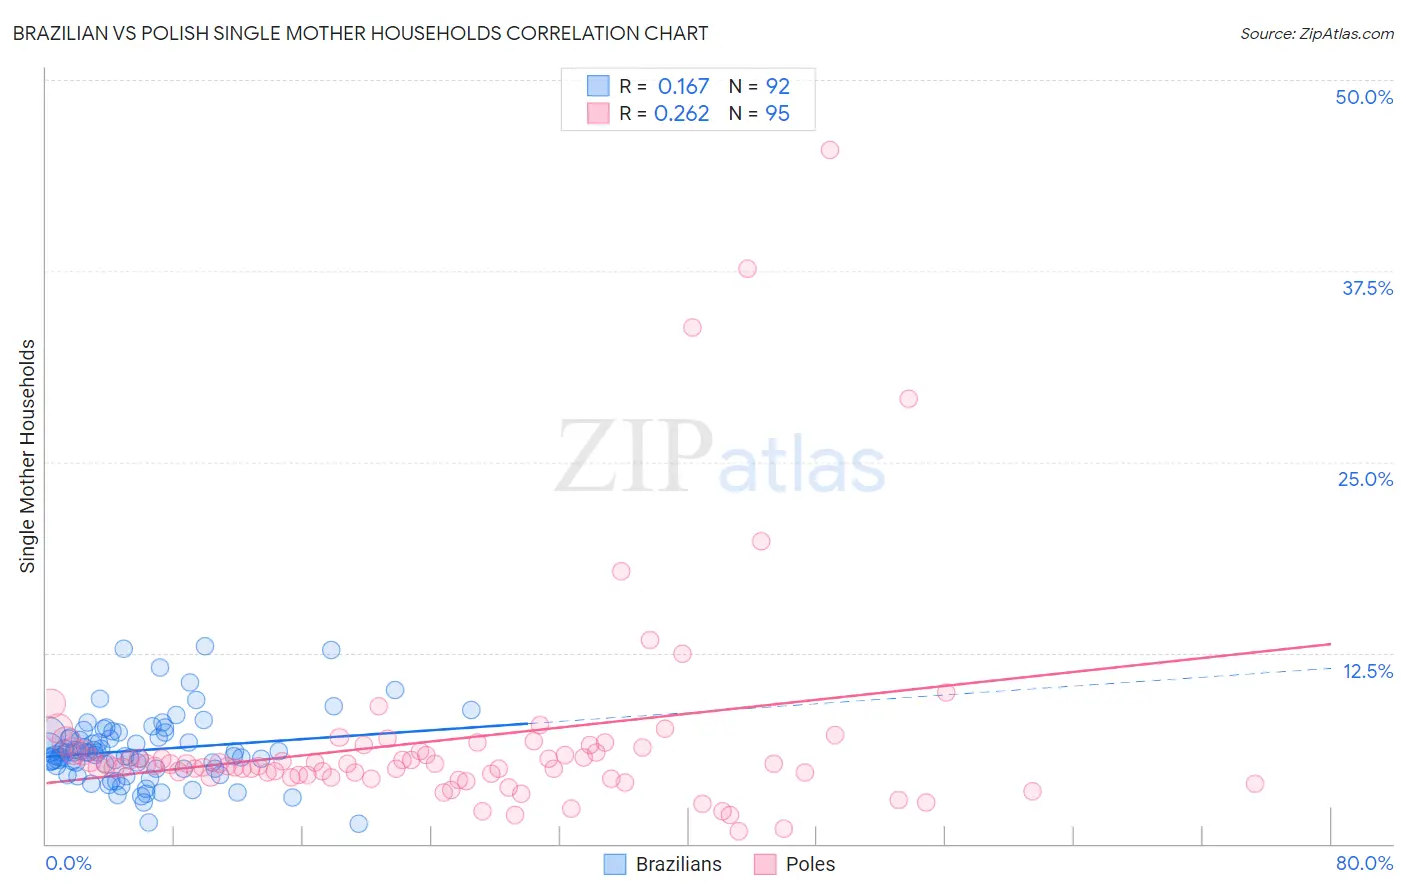
Brazilian vs Polish Single Mother Households Correlation Chart
The statistical analysis conducted on geographies consisting of 323,280,252 people shows a poor positive correlation between the proportion of Brazilians and percentage of single mother households in the United States with a correlation coefficient (R) of 0.167 and weighted average of 6.2%. Similarly, the statistical analysis conducted on geographies consisting of 555,545,245 people shows a weak positive correlation between the proportion of Poles and percentage of single mother households in the United States with a correlation coefficient (R) of 0.262 and weighted average of 5.6%, a difference of 12.1%.
Single Mother Households Correlation Summary
| Measurement | Brazilian | Polish |
| Minimum | 1.3% | 0.85% |
| Maximum | 12.9% | 45.5% |
| Range | 11.6% | 44.6% |
| Mean | 6.1% | 6.8% |
| Median | 6.0% | 5.2% |
| Interquartile 25% (IQ1) | 4.9% | 4.4% |
| Interquartile 75% (IQ3) | 7.0% | 6.3% |
| Interquartile Range (IQR) | 2.1% | 1.9% |
| Standard Deviation (Sample) | 2.2% | 7.0% |
| Standard Deviation (Population) | 2.2% | 6.9% |
Similar Demographics by Single Mother Households
Demographics Similar to Brazilians by Single Mother Households
In terms of single mother households, the demographic groups most similar to Brazilians are Immigrants from Chile (6.3%, a difference of 0.090%), Puget Sound Salish (6.3%, a difference of 0.11%), Immigrants from Oceania (6.3%, a difference of 0.51%), Sri Lankan (6.2%, a difference of 0.57%), and Afghan (6.3%, a difference of 0.74%).
| Demographics | Rating | Rank | Single Mother Households |
| Iraqis | 73.0 /100 | #160 | Good 6.1% |
| Immigrants | Germany | 72.4 /100 | #161 | Good 6.1% |
| Immigrants | Zimbabwe | 69.9 /100 | #162 | Good 6.2% |
| Alsatians | 68.7 /100 | #163 | Good 6.2% |
| Immigrants | Northern Africa | 68.0 /100 | #164 | Good 6.2% |
| Immigrants | Syria | 67.4 /100 | #165 | Good 6.2% |
| Sri Lankans | 63.9 /100 | #166 | Good 6.2% |
| Brazilians | 59.1 /100 | #167 | Average 6.2% |
| Immigrants | Chile | 58.3 /100 | #168 | Average 6.3% |
| Puget Sound Salish | 58.1 /100 | #169 | Average 6.3% |
| Immigrants | Oceania | 54.6 /100 | #170 | Average 6.3% |
| Afghans | 52.5 /100 | #171 | Average 6.3% |
| Immigrants | South Eastern Asia | 52.2 /100 | #172 | Average 6.3% |
| Immigrants | Vietnam | 51.5 /100 | #173 | Average 6.3% |
| Immigrants | Morocco | 50.0 /100 | #174 | Average 6.3% |
Demographics Similar to Poles by Single Mother Households
In terms of single mother households, the demographic groups most similar to Poles are Australian (5.6%, a difference of 0.010%), Immigrants from North Macedonia (5.6%, a difference of 0.070%), Immigrants from Norway (5.6%, a difference of 0.080%), Immigrants from France (5.6%, a difference of 0.10%), and Greek (5.6%, a difference of 0.15%).
| Demographics | Rating | Rank | Single Mother Households |
| Immigrants | Denmark | 99.1 /100 | #55 | Exceptional 5.5% |
| Immigrants | Romania | 99.0 /100 | #56 | Exceptional 5.5% |
| Immigrants | Europe | 99.0 /100 | #57 | Exceptional 5.5% |
| Danes | 98.9 /100 | #58 | Exceptional 5.5% |
| Luxembourgers | 98.7 /100 | #59 | Exceptional 5.6% |
| Immigrants | Norway | 98.7 /100 | #60 | Exceptional 5.6% |
| Australians | 98.7 /100 | #61 | Exceptional 5.6% |
| Poles | 98.6 /100 | #62 | Exceptional 5.6% |
| Immigrants | North Macedonia | 98.6 /100 | #63 | Exceptional 5.6% |
| Immigrants | France | 98.6 /100 | #64 | Exceptional 5.6% |
| Greeks | 98.6 /100 | #65 | Exceptional 5.6% |
| Immigrants | Canada | 98.5 /100 | #66 | Exceptional 5.6% |
| Italians | 98.5 /100 | #67 | Exceptional 5.6% |
| Immigrants | Bulgaria | 98.5 /100 | #68 | Exceptional 5.6% |
| Asians | 98.5 /100 | #69 | Exceptional 5.6% |