Immigrants from Jordan vs Tsimshian Single Mother Households
COMPARE
Immigrants from Jordan
Tsimshian
Single Mother Households
Single Mother Households Comparison
Immigrants from Jordan
Tsimshian
6.0%
SINGLE MOTHER HOUSEHOLDS
82.3/ 100
METRIC RATING
147th/ 347
METRIC RANK
6.0%
SINGLE MOTHER HOUSEHOLDS
85.2/ 100
METRIC RATING
141st/ 347
METRIC RANK
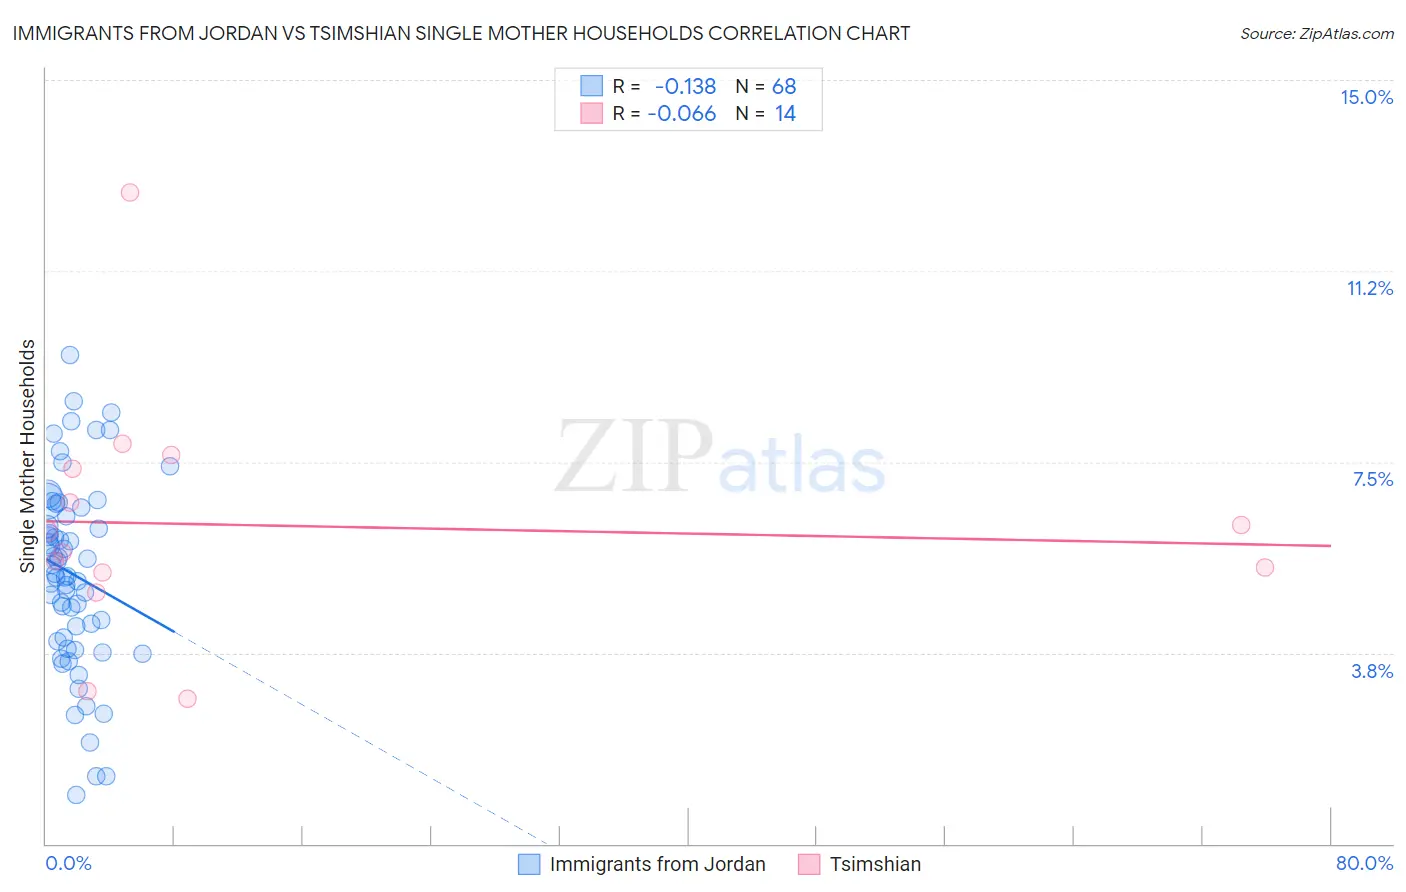
Immigrants from Jordan vs Tsimshian Single Mother Households Correlation Chart
The statistical analysis conducted on geographies consisting of 181,167,128 people shows a poor negative correlation between the proportion of Immigrants from Jordan and percentage of single mother households in the United States with a correlation coefficient (R) of -0.138 and weighted average of 6.0%. Similarly, the statistical analysis conducted on geographies consisting of 15,617,285 people shows a slight negative correlation between the proportion of Tsimshian and percentage of single mother households in the United States with a correlation coefficient (R) of -0.066 and weighted average of 6.0%, a difference of 0.63%.
Single Mother Households Correlation Summary
| Measurement | Immigrants from Jordan | Tsimshian |
| Minimum | 0.95% | 2.8% |
| Maximum | 9.6% | 12.8% |
| Range | 8.7% | 10.0% |
| Mean | 5.3% | 6.3% |
| Median | 5.3% | 5.9% |
| Interquartile 25% (IQ1) | 4.0% | 5.3% |
| Interquartile 75% (IQ3) | 6.5% | 7.4% |
| Interquartile Range (IQR) | 2.5% | 2.1% |
| Standard Deviation (Sample) | 1.8% | 2.4% |
| Standard Deviation (Population) | 1.8% | 2.3% |
Demographics Similar to Immigrants from Jordan and Tsimshian by Single Mother Households
In terms of single mother households, the demographic groups most similar to Immigrants from Jordan are Scotch-Irish (6.0%, a difference of 0.050%), French Canadian (6.0%, a difference of 0.060%), Immigrants from Albania (6.1%, a difference of 0.15%), Zimbabwean (6.1%, a difference of 0.29%), and Immigrants from Southern Europe (6.1%, a difference of 0.34%). Similarly, the demographic groups most similar to Tsimshian are Immigrants from Egypt (6.0%, a difference of 0.050%), Immigrants from Iraq (6.0%, a difference of 0.090%), French (6.0%, a difference of 0.10%), Syrian (6.0%, a difference of 0.17%), and Korean (6.0%, a difference of 0.19%).
| Demographics | Rating | Rank | Single Mother Households |
| Canadians | 90.5 /100 | #134 | Exceptional 5.9% |
| Immigrants | Saudi Arabia | 90.2 /100 | #135 | Exceptional 5.9% |
| Jordanians | 88.9 /100 | #136 | Excellent 6.0% |
| Immigrants | Pakistan | 88.4 /100 | #137 | Excellent 6.0% |
| Icelanders | 86.9 /100 | #138 | Excellent 6.0% |
| Syrians | 86.0 /100 | #139 | Excellent 6.0% |
| French | 85.7 /100 | #140 | Excellent 6.0% |
| Tsimshian | 85.2 /100 | #141 | Excellent 6.0% |
| Immigrants | Egypt | 85.0 /100 | #142 | Excellent 6.0% |
| Immigrants | Iraq | 84.8 /100 | #143 | Excellent 6.0% |
| Koreans | 84.4 /100 | #144 | Excellent 6.0% |
| Arabs | 84.0 /100 | #145 | Excellent 6.0% |
| French Canadians | 82.6 /100 | #146 | Excellent 6.0% |
| Immigrants | Jordan | 82.3 /100 | #147 | Excellent 6.0% |
| Scotch-Irish | 82.0 /100 | #148 | Excellent 6.0% |
| Immigrants | Albania | 81.5 /100 | #149 | Excellent 6.1% |
| Zimbabweans | 80.7 /100 | #150 | Excellent 6.1% |
| Immigrants | Southern Europe | 80.5 /100 | #151 | Excellent 6.1% |
| Pakistanis | 79.2 /100 | #152 | Good 6.1% |
| Immigrants | Brazil | 78.9 /100 | #153 | Good 6.1% |
| Immigrants | Philippines | 78.5 /100 | #154 | Good 6.1% |