Immigrants from Burma/Myanmar vs Polish Single Mother Households
COMPARE
Immigrants from Burma/Myanmar
Polish
Single Mother Households
Single Mother Households Comparison
Immigrants from Burma/Myanmar
Poles
7.0%
SINGLE MOTHER HOUSEHOLDS
1.4/ 100
METRIC RATING
235th/ 347
METRIC RANK
5.6%
SINGLE MOTHER HOUSEHOLDS
98.6/ 100
METRIC RATING
62nd/ 347
METRIC RANK
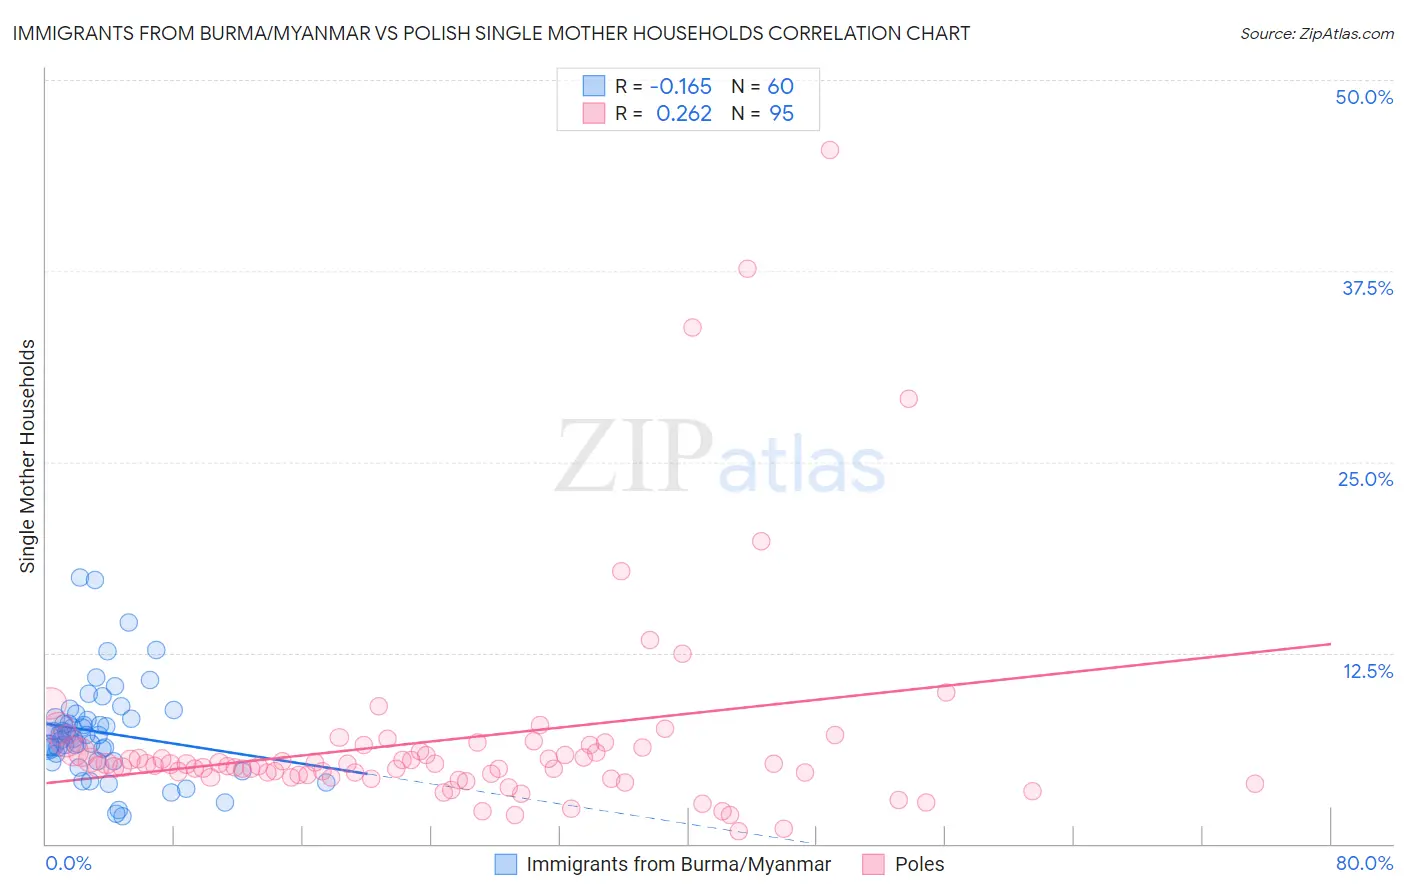
Immigrants from Burma/Myanmar vs Polish Single Mother Households Correlation Chart
The statistical analysis conducted on geographies consisting of 172,110,214 people shows a poor negative correlation between the proportion of Immigrants from Burma/Myanmar and percentage of single mother households in the United States with a correlation coefficient (R) of -0.165 and weighted average of 7.0%. Similarly, the statistical analysis conducted on geographies consisting of 555,545,245 people shows a weak positive correlation between the proportion of Poles and percentage of single mother households in the United States with a correlation coefficient (R) of 0.262 and weighted average of 5.6%, a difference of 26.5%.
Single Mother Households Correlation Summary
| Measurement | Immigrants from Burma/Myanmar | Polish |
| Minimum | 1.8% | 0.85% |
| Maximum | 17.4% | 45.5% |
| Range | 15.6% | 44.6% |
| Mean | 7.3% | 6.8% |
| Median | 7.1% | 5.2% |
| Interquartile 25% (IQ1) | 5.6% | 4.4% |
| Interquartile 75% (IQ3) | 8.2% | 6.3% |
| Interquartile Range (IQR) | 2.6% | 1.9% |
| Standard Deviation (Sample) | 3.1% | 7.0% |
| Standard Deviation (Population) | 3.1% | 6.9% |
Similar Demographics by Single Mother Households
Demographics Similar to Immigrants from Burma/Myanmar by Single Mother Households
In terms of single mother households, the demographic groups most similar to Immigrants from Burma/Myanmar are Chickasaw (7.0%, a difference of 0.070%), Choctaw (7.0%, a difference of 0.090%), Comanche (7.0%, a difference of 0.26%), Spanish American (7.0%, a difference of 0.32%), and Creek (7.0%, a difference of 0.34%).
| Demographics | Rating | Rank | Single Mother Households |
| Iroquois | 2.2 /100 | #228 | Tragic 7.0% |
| Immigrants | Kenya | 2.1 /100 | #229 | Tragic 7.0% |
| Creek | 1.6 /100 | #230 | Tragic 7.0% |
| Spanish Americans | 1.6 /100 | #231 | Tragic 7.0% |
| Comanche | 1.5 /100 | #232 | Tragic 7.0% |
| Choctaw | 1.4 /100 | #233 | Tragic 7.0% |
| Chickasaw | 1.4 /100 | #234 | Tragic 7.0% |
| Immigrants | Burma/Myanmar | 1.4 /100 | #235 | Tragic 7.0% |
| Ute | 1.0 /100 | #236 | Tragic 7.1% |
| Arapaho | 1.0 /100 | #237 | Tragic 7.1% |
| Panamanians | 0.9 /100 | #238 | Tragic 7.1% |
| Kiowa | 0.8 /100 | #239 | Tragic 7.1% |
| Immigrants | Panama | 0.7 /100 | #240 | Tragic 7.2% |
| Immigrants | Portugal | 0.6 /100 | #241 | Tragic 7.2% |
| Fijians | 0.6 /100 | #242 | Tragic 7.2% |
Demographics Similar to Poles by Single Mother Households
In terms of single mother households, the demographic groups most similar to Poles are Australian (5.6%, a difference of 0.010%), Immigrants from North Macedonia (5.6%, a difference of 0.070%), Immigrants from Norway (5.6%, a difference of 0.080%), Immigrants from France (5.6%, a difference of 0.10%), and Greek (5.6%, a difference of 0.15%).
| Demographics | Rating | Rank | Single Mother Households |
| Immigrants | Denmark | 99.1 /100 | #55 | Exceptional 5.5% |
| Immigrants | Romania | 99.0 /100 | #56 | Exceptional 5.5% |
| Immigrants | Europe | 99.0 /100 | #57 | Exceptional 5.5% |
| Danes | 98.9 /100 | #58 | Exceptional 5.5% |
| Luxembourgers | 98.7 /100 | #59 | Exceptional 5.6% |
| Immigrants | Norway | 98.7 /100 | #60 | Exceptional 5.6% |
| Australians | 98.7 /100 | #61 | Exceptional 5.6% |
| Poles | 98.6 /100 | #62 | Exceptional 5.6% |
| Immigrants | North Macedonia | 98.6 /100 | #63 | Exceptional 5.6% |
| Immigrants | France | 98.6 /100 | #64 | Exceptional 5.6% |
| Greeks | 98.6 /100 | #65 | Exceptional 5.6% |
| Immigrants | Canada | 98.5 /100 | #66 | Exceptional 5.6% |
| Italians | 98.5 /100 | #67 | Exceptional 5.6% |
| Immigrants | Bulgaria | 98.5 /100 | #68 | Exceptional 5.6% |
| Asians | 98.5 /100 | #69 | Exceptional 5.6% |