Immigrants from Jordan vs Polish Male Unemployment
COMPARE
Immigrants from Jordan
Polish
Male Unemployment
Male Unemployment Comparison
Immigrants from Jordan
Poles
5.1%
MALE UNEMPLOYMENT
91.9/ 100
METRIC RATING
103rd/ 347
METRIC RANK
4.9%
MALE UNEMPLOYMENT
98.9/ 100
METRIC RATING
49th/ 347
METRIC RANK
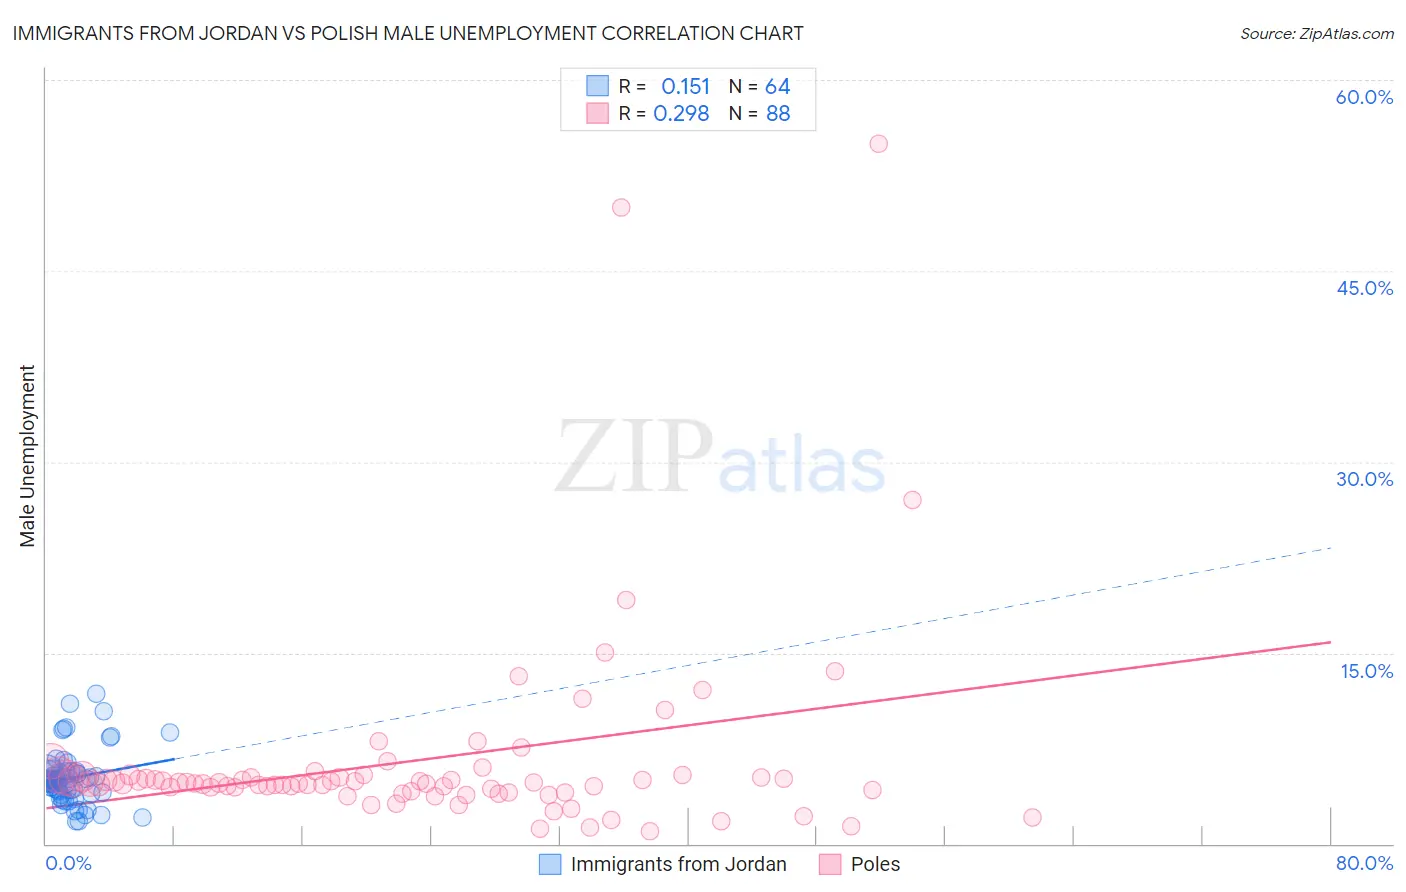
Immigrants from Jordan vs Polish Male Unemployment Correlation Chart
The statistical analysis conducted on geographies consisting of 181,155,551 people shows a poor positive correlation between the proportion of Immigrants from Jordan and unemployment rate among males in the United States with a correlation coefficient (R) of 0.151 and weighted average of 5.1%. Similarly, the statistical analysis conducted on geographies consisting of 550,894,735 people shows a weak positive correlation between the proportion of Poles and unemployment rate among males in the United States with a correlation coefficient (R) of 0.298 and weighted average of 4.9%, a difference of 3.2%.
Male Unemployment Correlation Summary
| Measurement | Immigrants from Jordan | Polish |
| Minimum | 1.8% | 1.0% |
| Maximum | 11.8% | 55.0% |
| Range | 10.0% | 54.0% |
| Mean | 5.2% | 6.5% |
| Median | 5.0% | 4.8% |
| Interquartile 25% (IQ1) | 4.0% | 4.1% |
| Interquartile 75% (IQ3) | 5.6% | 5.3% |
| Interquartile Range (IQR) | 1.7% | 1.1% |
| Standard Deviation (Sample) | 2.1% | 8.0% |
| Standard Deviation (Population) | 2.1% | 7.9% |
Similar Demographics by Male Unemployment
Demographics Similar to Immigrants from Jordan by Male Unemployment
In terms of male unemployment, the demographic groups most similar to Immigrants from Jordan are Immigrants from Chile (5.1%, a difference of 0.030%), Immigrants from Czechoslovakia (5.1%, a difference of 0.040%), Immigrants from Ethiopia (5.1%, a difference of 0.080%), Ethiopian (5.1%, a difference of 0.12%), and Immigrants from Nicaragua (5.1%, a difference of 0.13%).
| Demographics | Rating | Rank | Male Unemployment |
| Asians | 93.7 /100 | #96 | Exceptional 5.1% |
| Immigrants | Spain | 93.4 /100 | #97 | Exceptional 5.1% |
| Immigrants | Kuwait | 93.3 /100 | #98 | Exceptional 5.1% |
| Uruguayans | 93.0 /100 | #99 | Exceptional 5.1% |
| Russians | 92.9 /100 | #100 | Exceptional 5.1% |
| German Russians | 92.7 /100 | #101 | Exceptional 5.1% |
| Immigrants | France | 92.7 /100 | #102 | Exceptional 5.1% |
| Immigrants | Jordan | 91.9 /100 | #103 | Exceptional 5.1% |
| Immigrants | Chile | 91.8 /100 | #104 | Exceptional 5.1% |
| Immigrants | Czechoslovakia | 91.7 /100 | #105 | Exceptional 5.1% |
| Immigrants | Ethiopia | 91.5 /100 | #106 | Exceptional 5.1% |
| Ethiopians | 91.3 /100 | #107 | Exceptional 5.1% |
| Immigrants | Nicaragua | 91.2 /100 | #108 | Exceptional 5.1% |
| Immigrants | Pakistan | 90.9 /100 | #109 | Exceptional 5.1% |
| Immigrants | England | 90.8 /100 | #110 | Exceptional 5.1% |
Demographics Similar to Poles by Male Unemployment
In terms of male unemployment, the demographic groups most similar to Poles are Immigrants from Scotland (4.9%, a difference of 0.010%), Croatian (4.9%, a difference of 0.010%), Austrian (4.9%, a difference of 0.030%), Slovene (5.0%, a difference of 0.040%), and Irish (5.0%, a difference of 0.060%).
| Demographics | Rating | Rank | Male Unemployment |
| Immigrants | Belgium | 99.2 /100 | #42 | Exceptional 4.9% |
| Immigrants | Japan | 99.2 /100 | #43 | Exceptional 4.9% |
| Immigrants | Korea | 99.1 /100 | #44 | Exceptional 4.9% |
| Immigrants | Zimbabwe | 99.0 /100 | #45 | Exceptional 4.9% |
| Bhutanese | 98.9 /100 | #46 | Exceptional 4.9% |
| Austrians | 98.9 /100 | #47 | Exceptional 4.9% |
| Immigrants | Scotland | 98.9 /100 | #48 | Exceptional 4.9% |
| Poles | 98.9 /100 | #49 | Exceptional 4.9% |
| Croatians | 98.9 /100 | #50 | Exceptional 4.9% |
| Slovenes | 98.8 /100 | #51 | Exceptional 5.0% |
| Irish | 98.8 /100 | #52 | Exceptional 5.0% |
| Jordanians | 98.8 /100 | #53 | Exceptional 5.0% |
| Yugoslavians | 98.7 /100 | #54 | Exceptional 5.0% |
| Czechoslovakians | 98.7 /100 | #55 | Exceptional 5.0% |
| Immigrants | Bulgaria | 98.7 /100 | #56 | Exceptional 5.0% |